Bar Plots
Bar plots are essential for comparing categorical data, showing distributions across groups, and visualizing survey results. Rekha’s bar plots support vertical and horizontal orientations, grouping, stacking, and custom styling.
Basic Usage
import rekha as rk
import pandas as pd

# Simple bar plot
df = pd.DataFrame({
    'category': ['A', 'B', 'C', 'D'],
    'value': [23, 45, 12, 67]
})

fig = rk.bar(df, x='category', y='value', title='Simple Bar Plot')
fig.show()
Examples Gallery
Basic Vertical Bar Plot
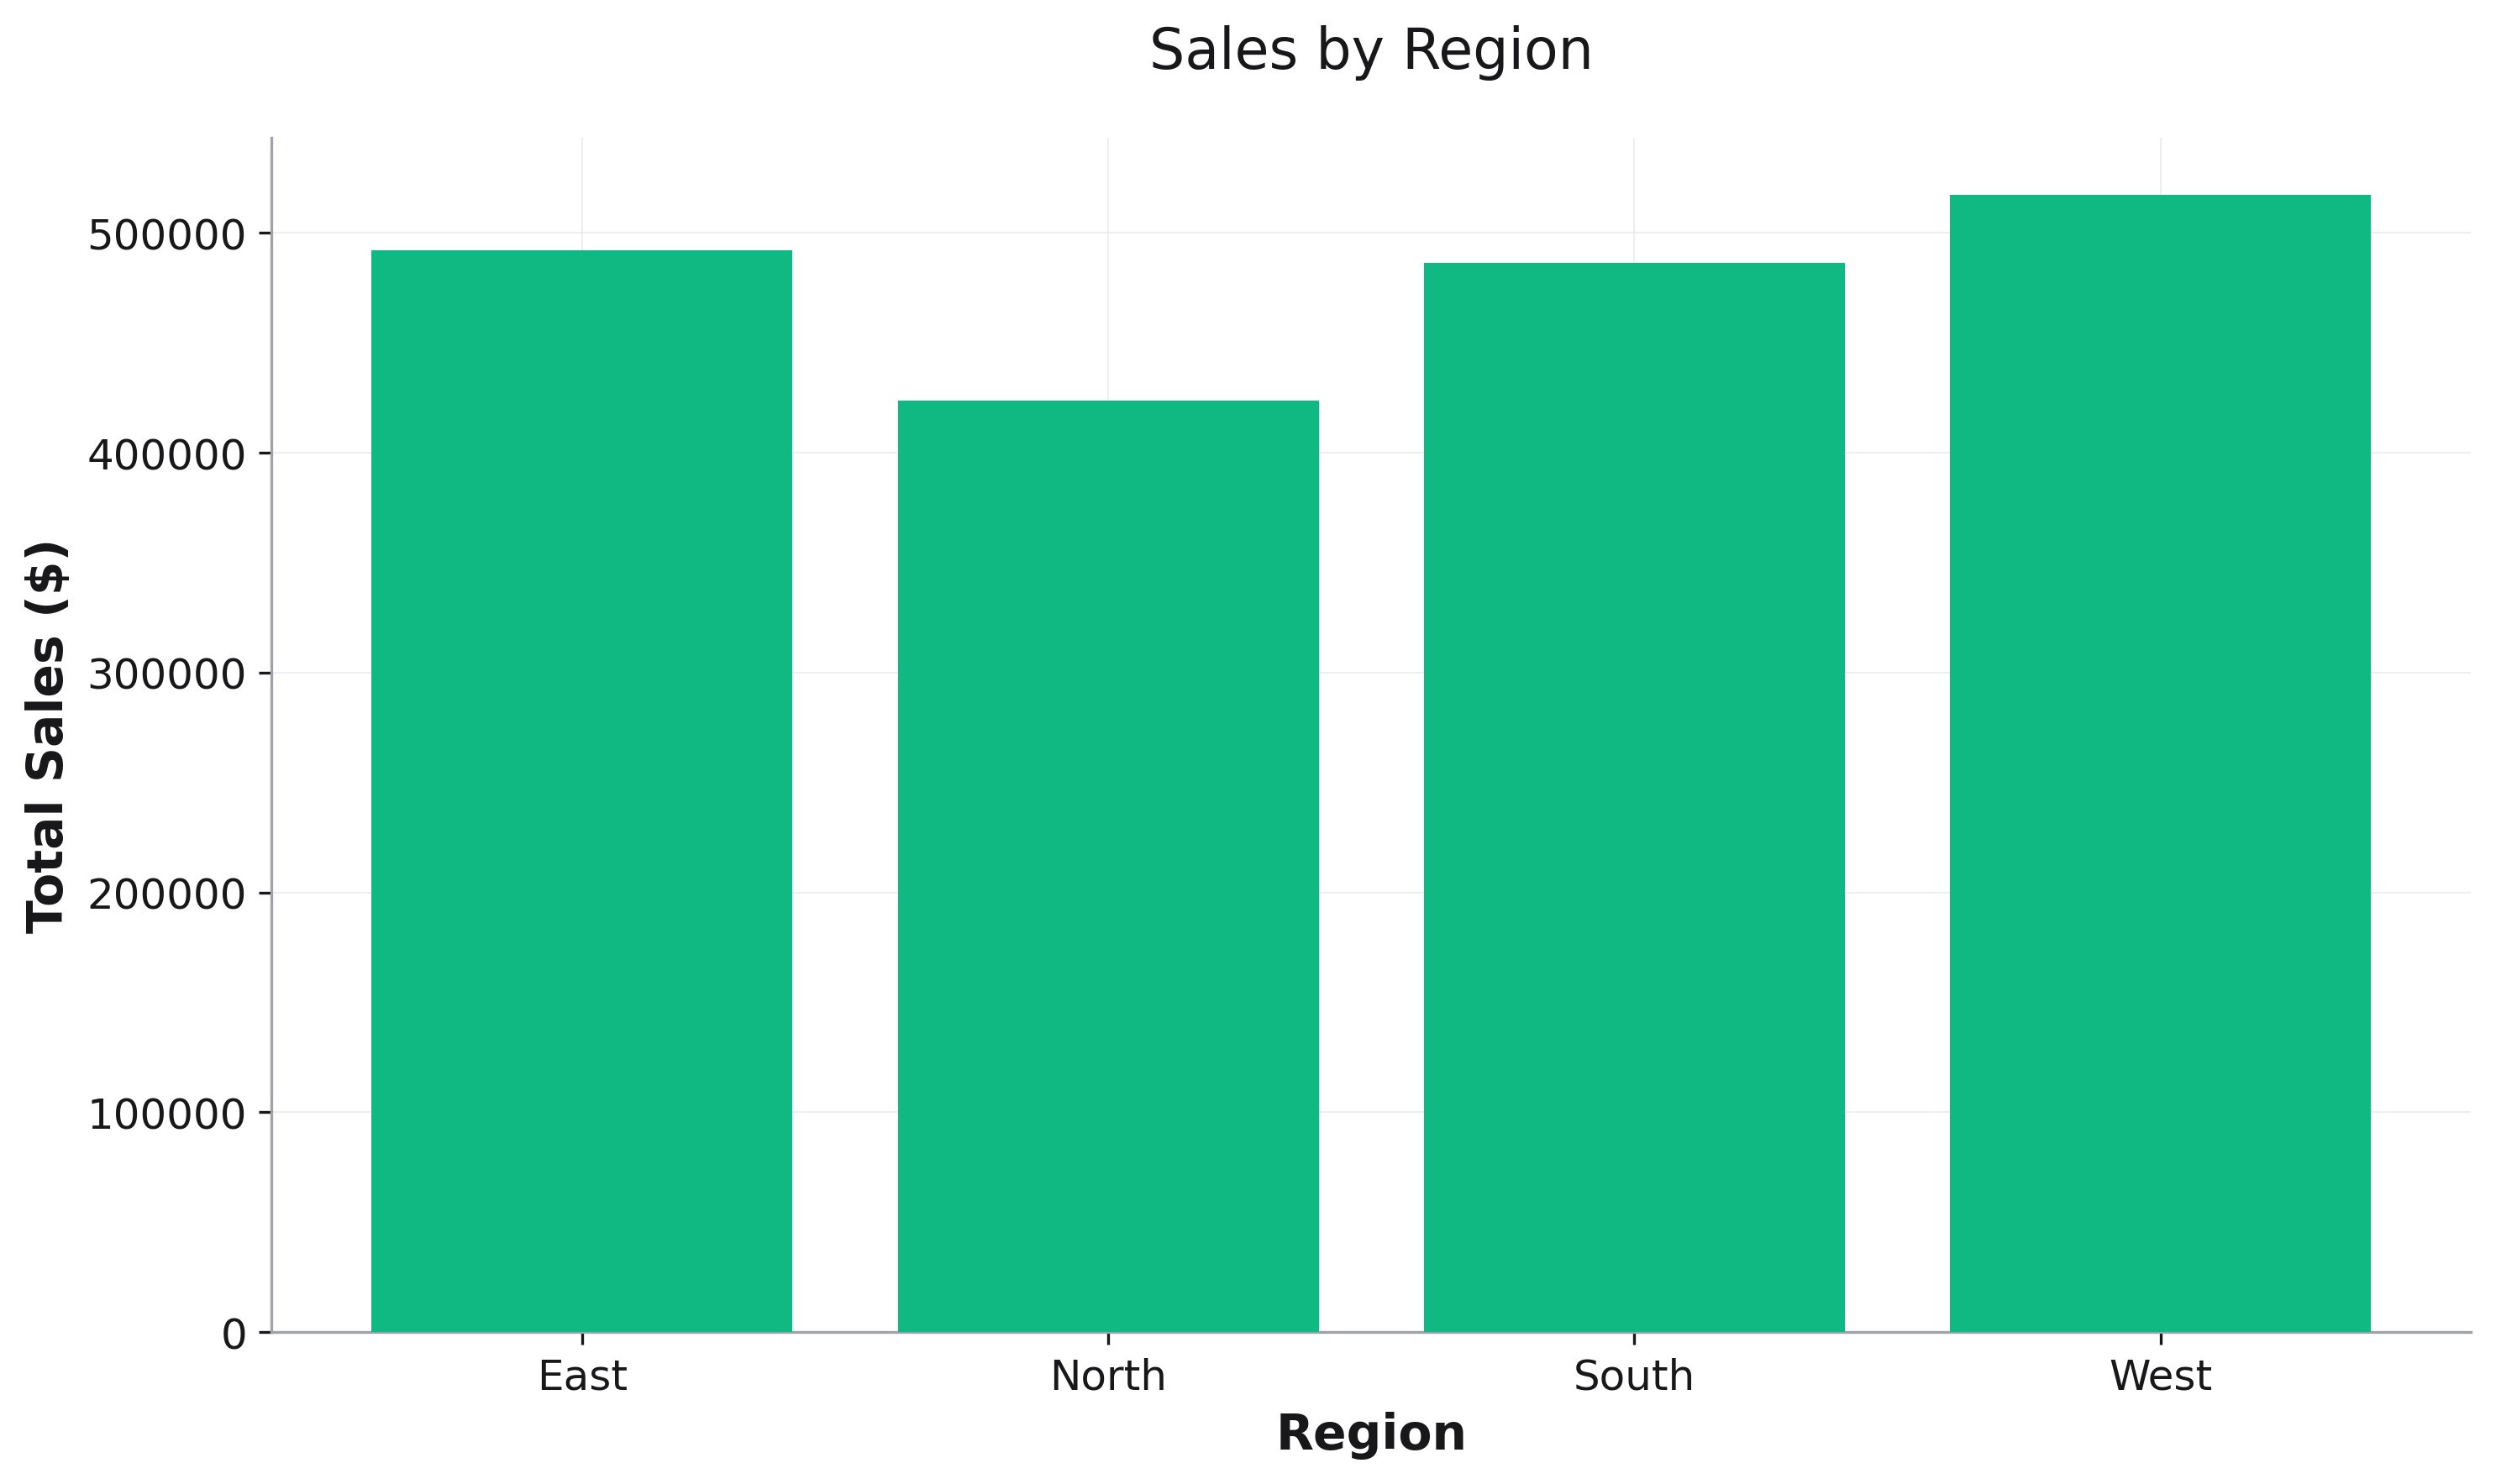
Simple categorical comparison:
import rekha as rk
from examples.utils import get_categorical_data

df = get_categorical_data()
region_sales = df.groupby('region')['sales'].sum().reset_index()

fig = rk.bar(
    data=region_sales,
    x='region',
    y='sales',
    title='Sales by Region',
    labels={'region': 'Region', 'sales': 'Total Sales ($)'}
)
Grouped Bar Plot
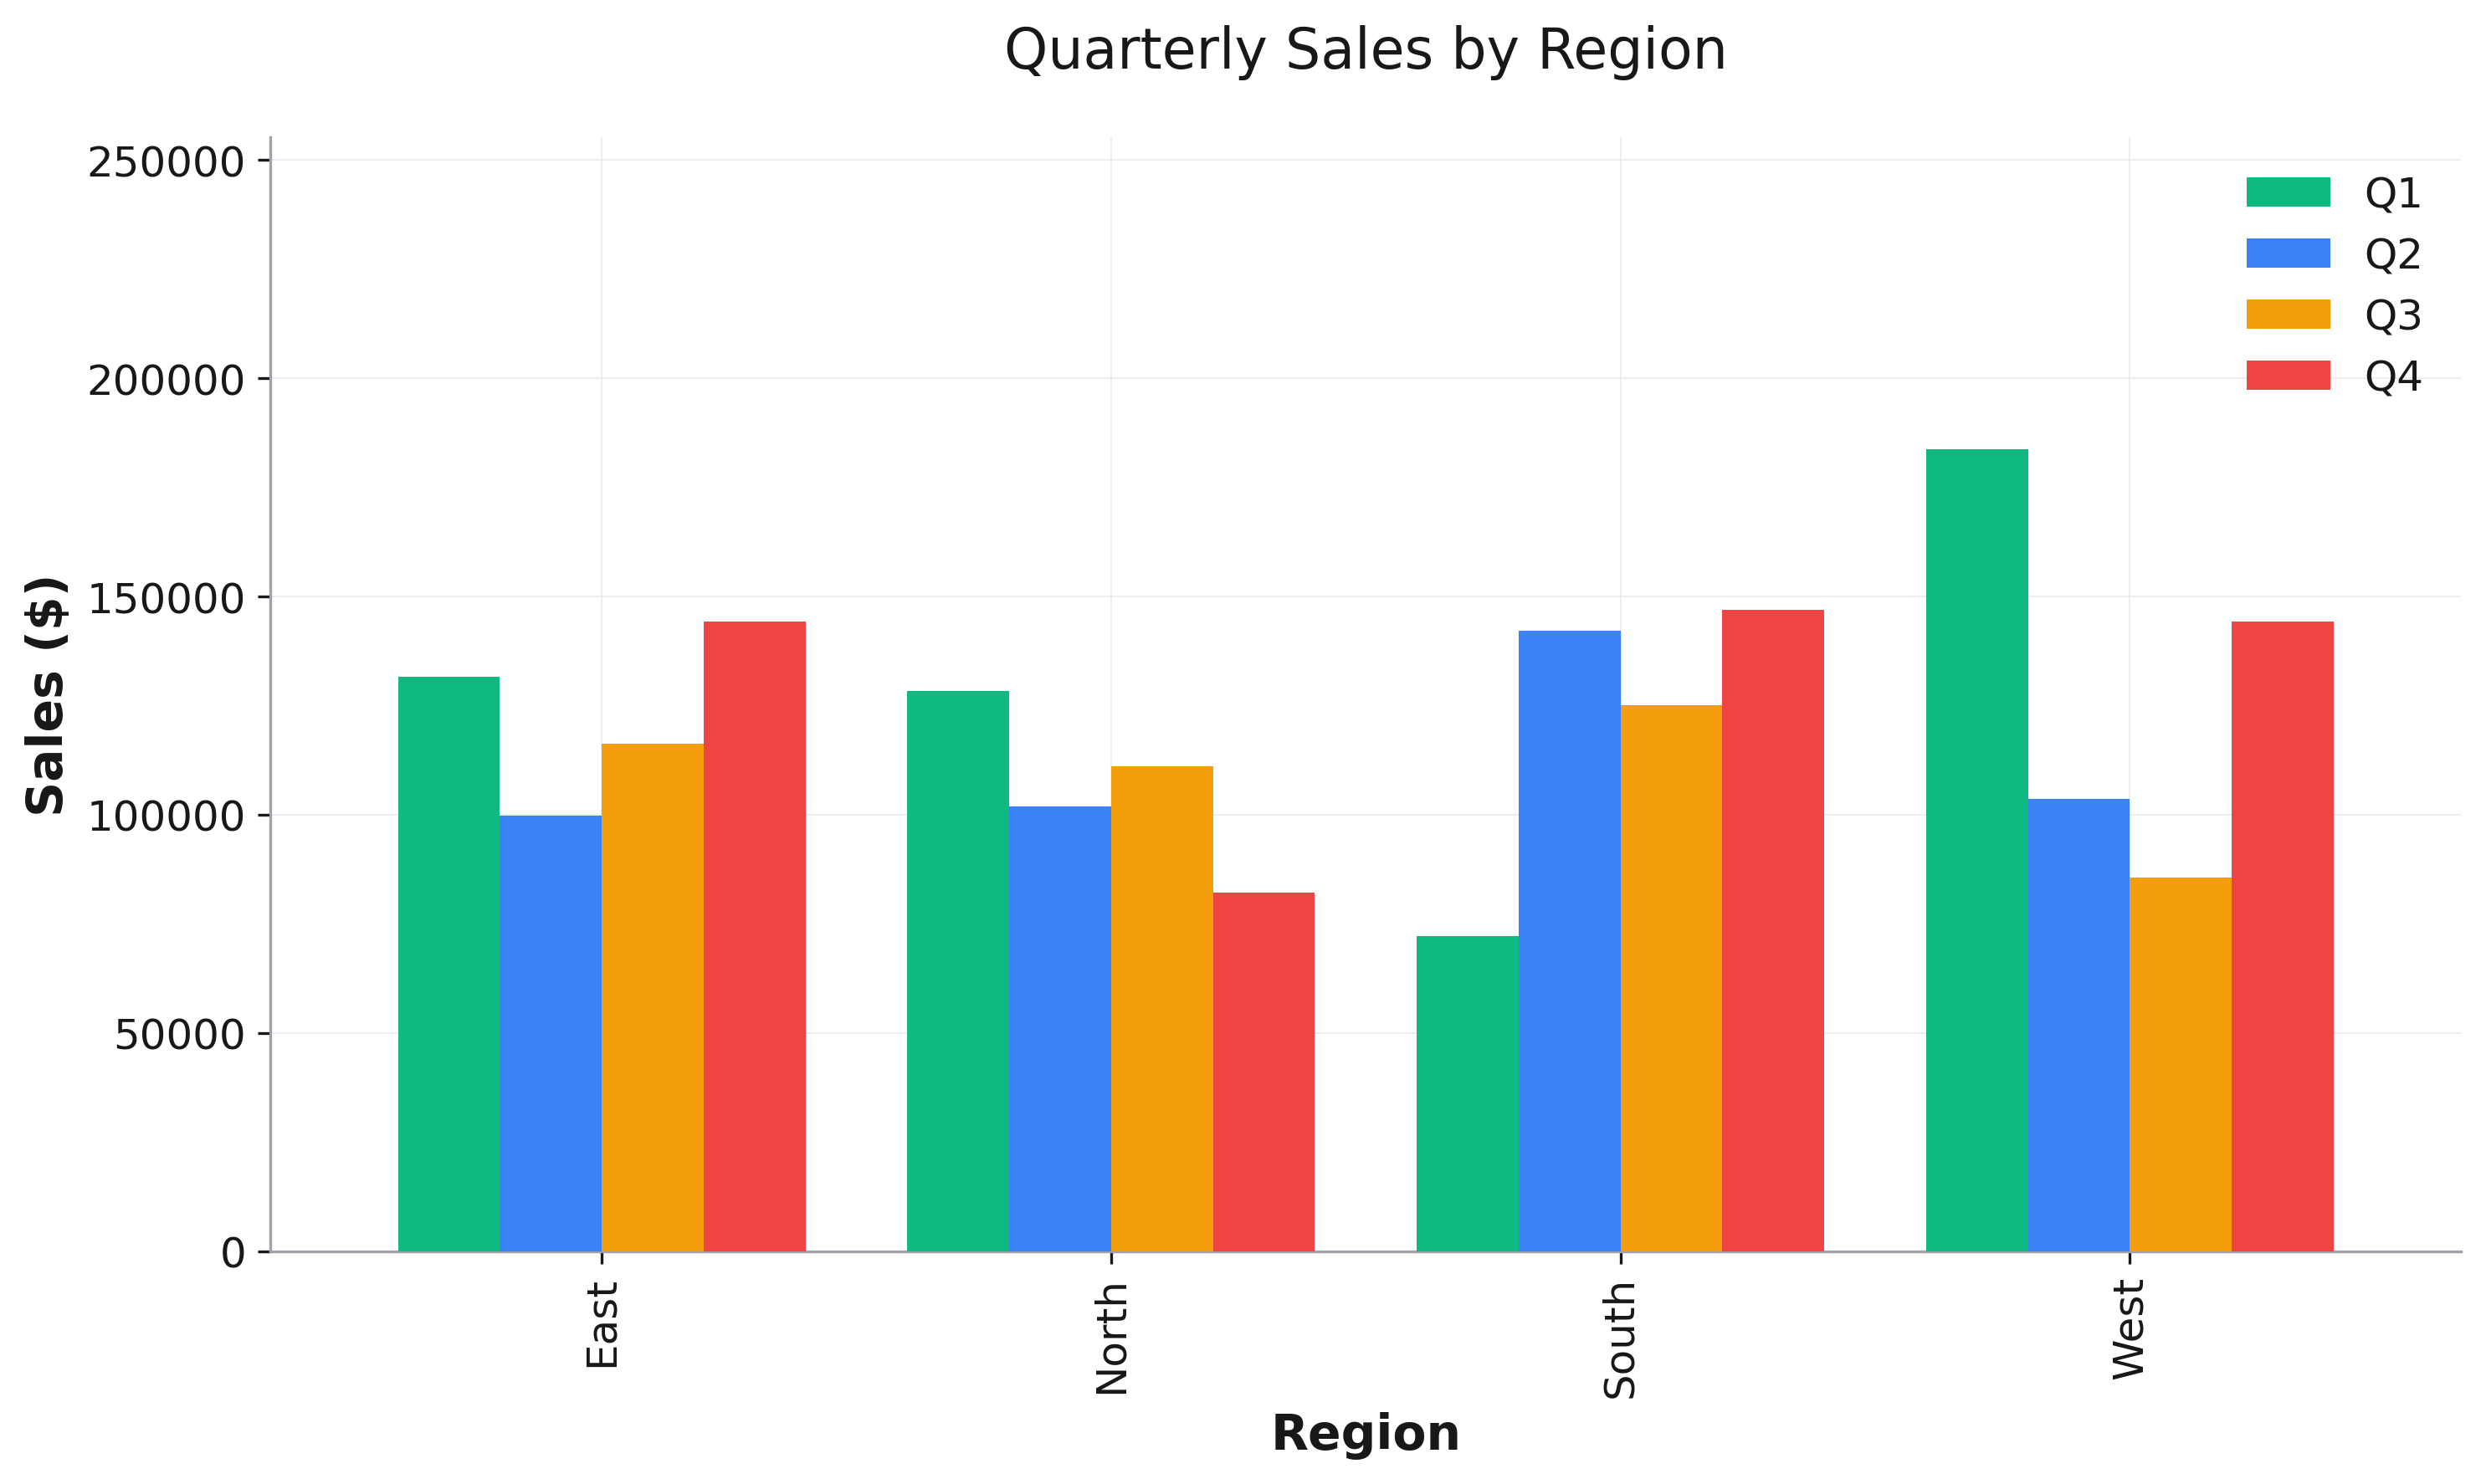
Compare multiple categories side by side:
quarter_region = df.groupby(['region', 'quarter'])['sales'].sum().reset_index()

fig = rk.bar(
    data=quarter_region,
    x='region',
    y='sales',
    color='quarter',
    title='Quarterly Sales by Region',
    labels={'region': 'Region', 'sales': 'Sales ($)', 'quarter': 'Quarter'}
)
Horizontal Bar Plot
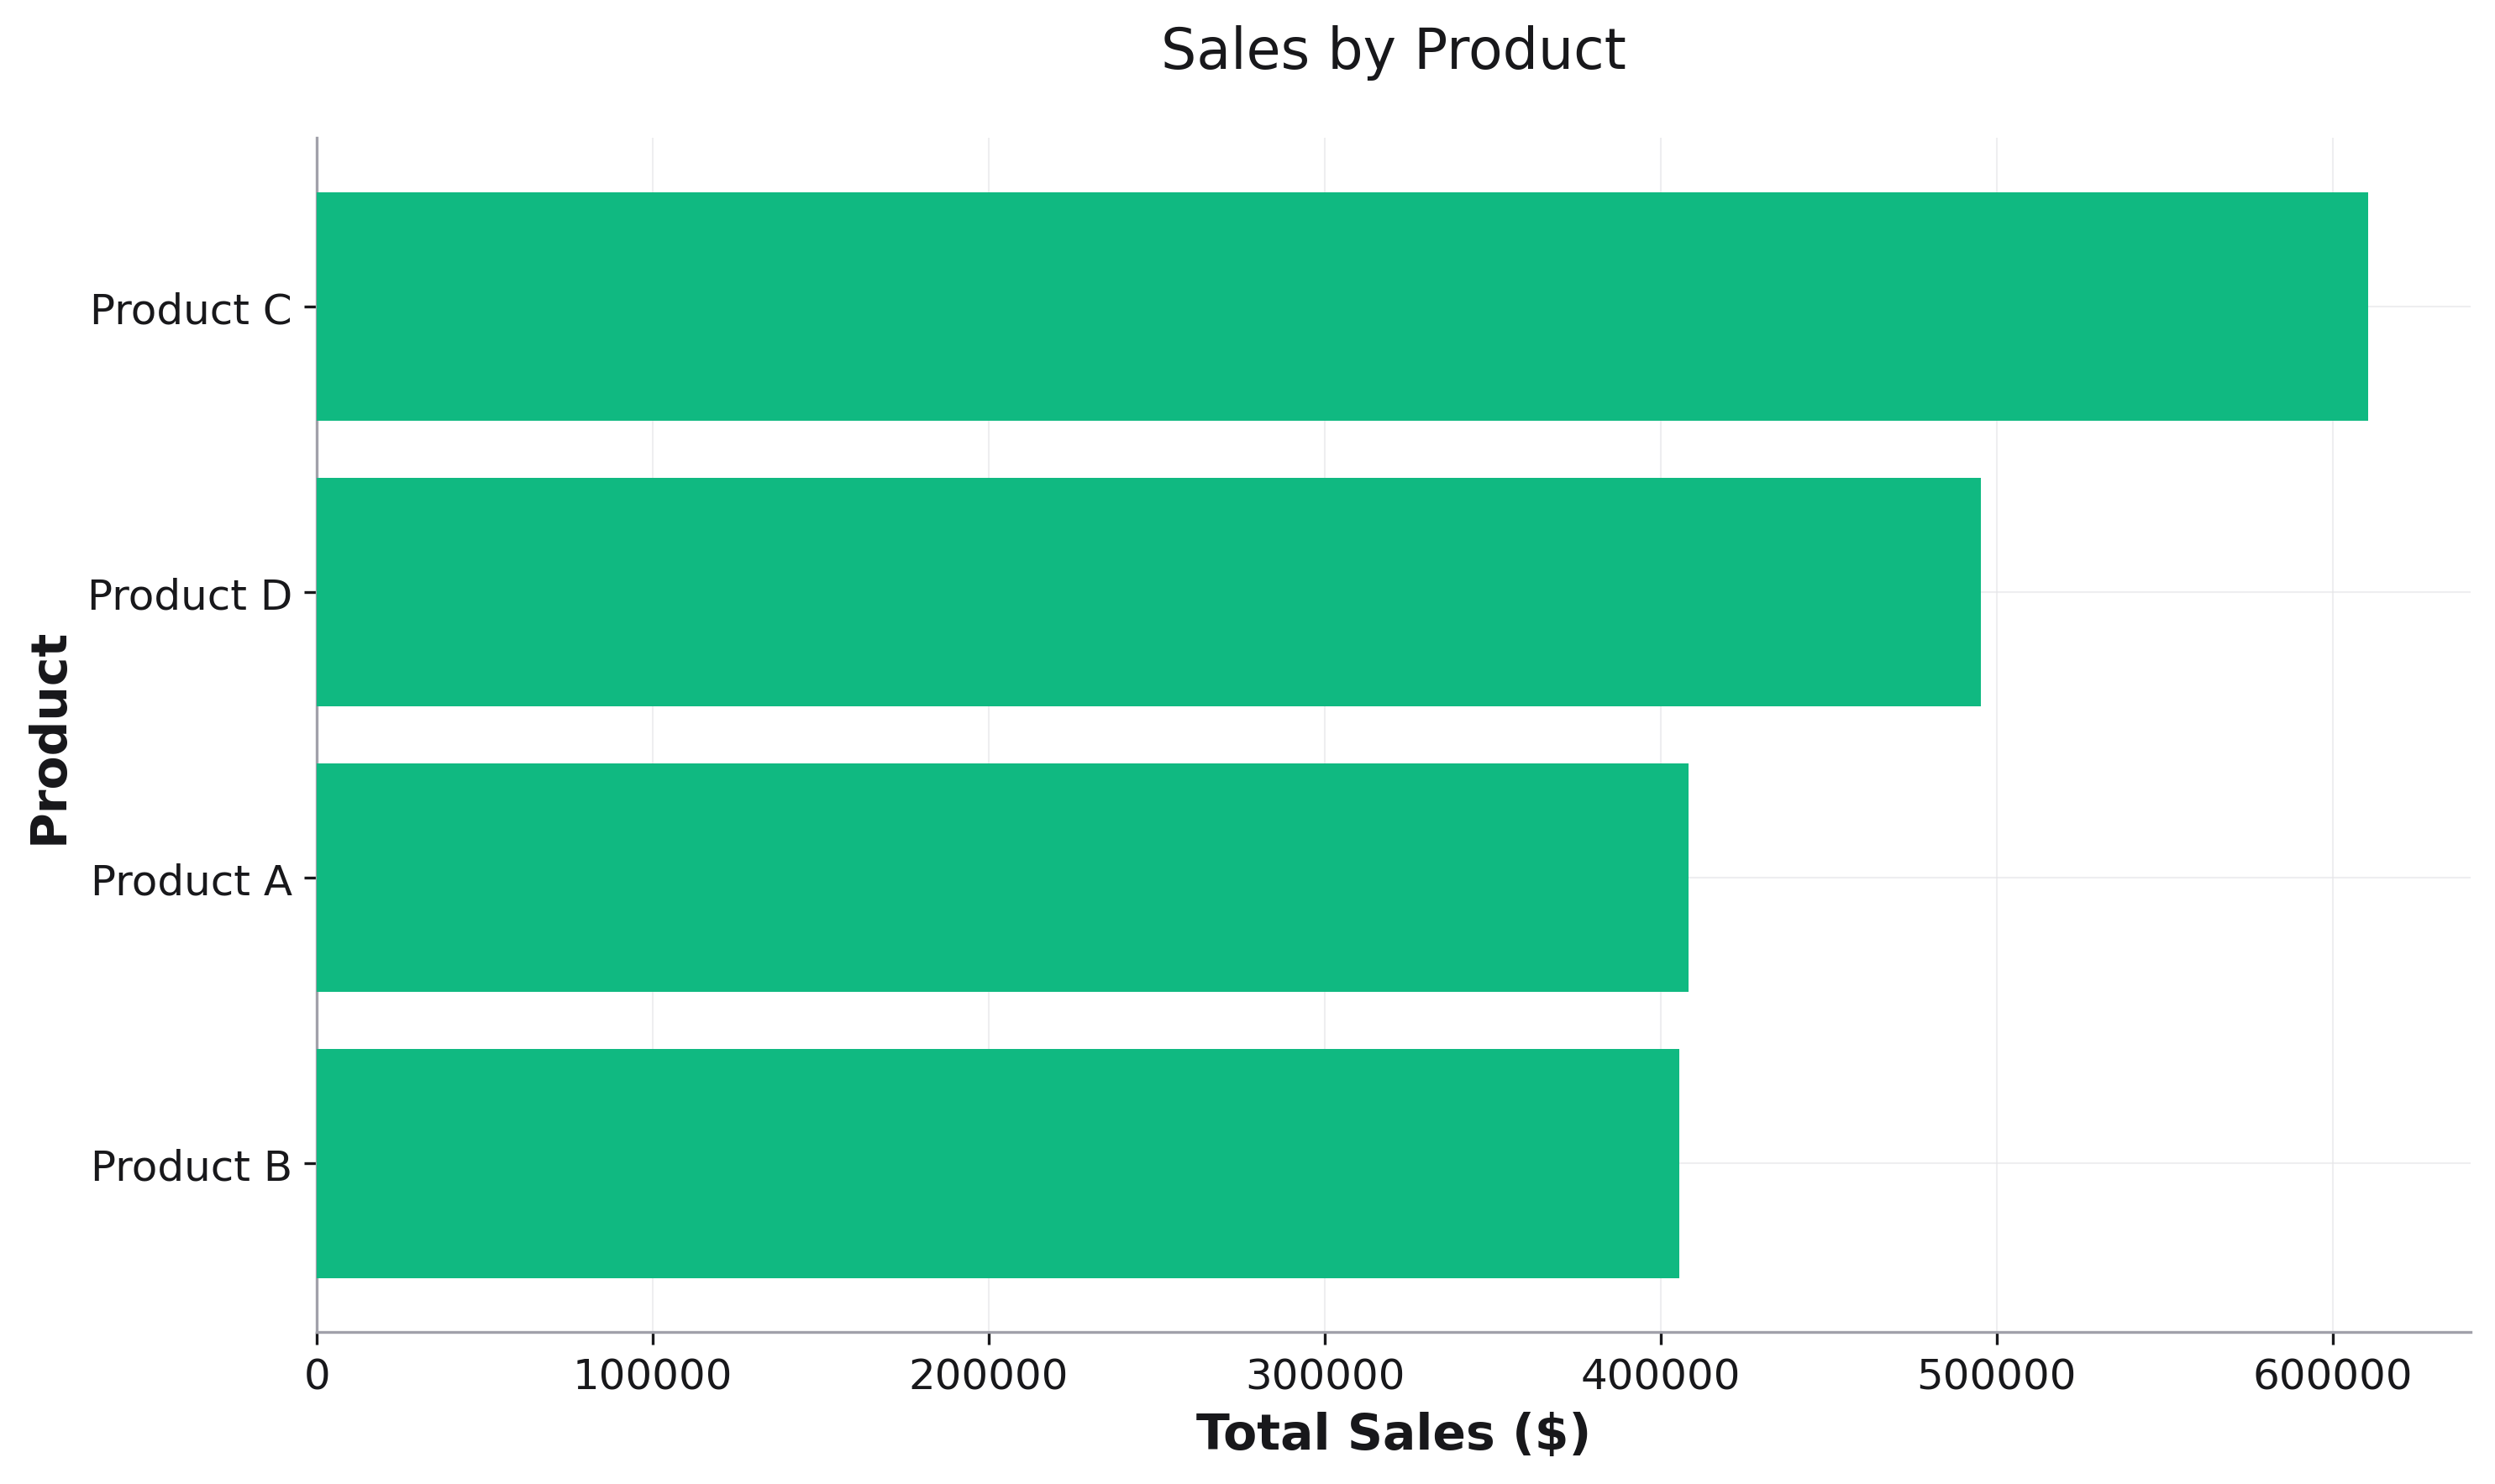
Better for long category names:
product_sales = df.groupby('product')['sales'].sum().reset_index().sort_values('sales')

fig = rk.bar(
    data=product_sales,
    x='sales',
    y='product',
    orientation='h',
    title='Sales by Product',
    labels={'sales': 'Total Sales ($)', 'product': 'Product'}
)
Stacked Bar Plot
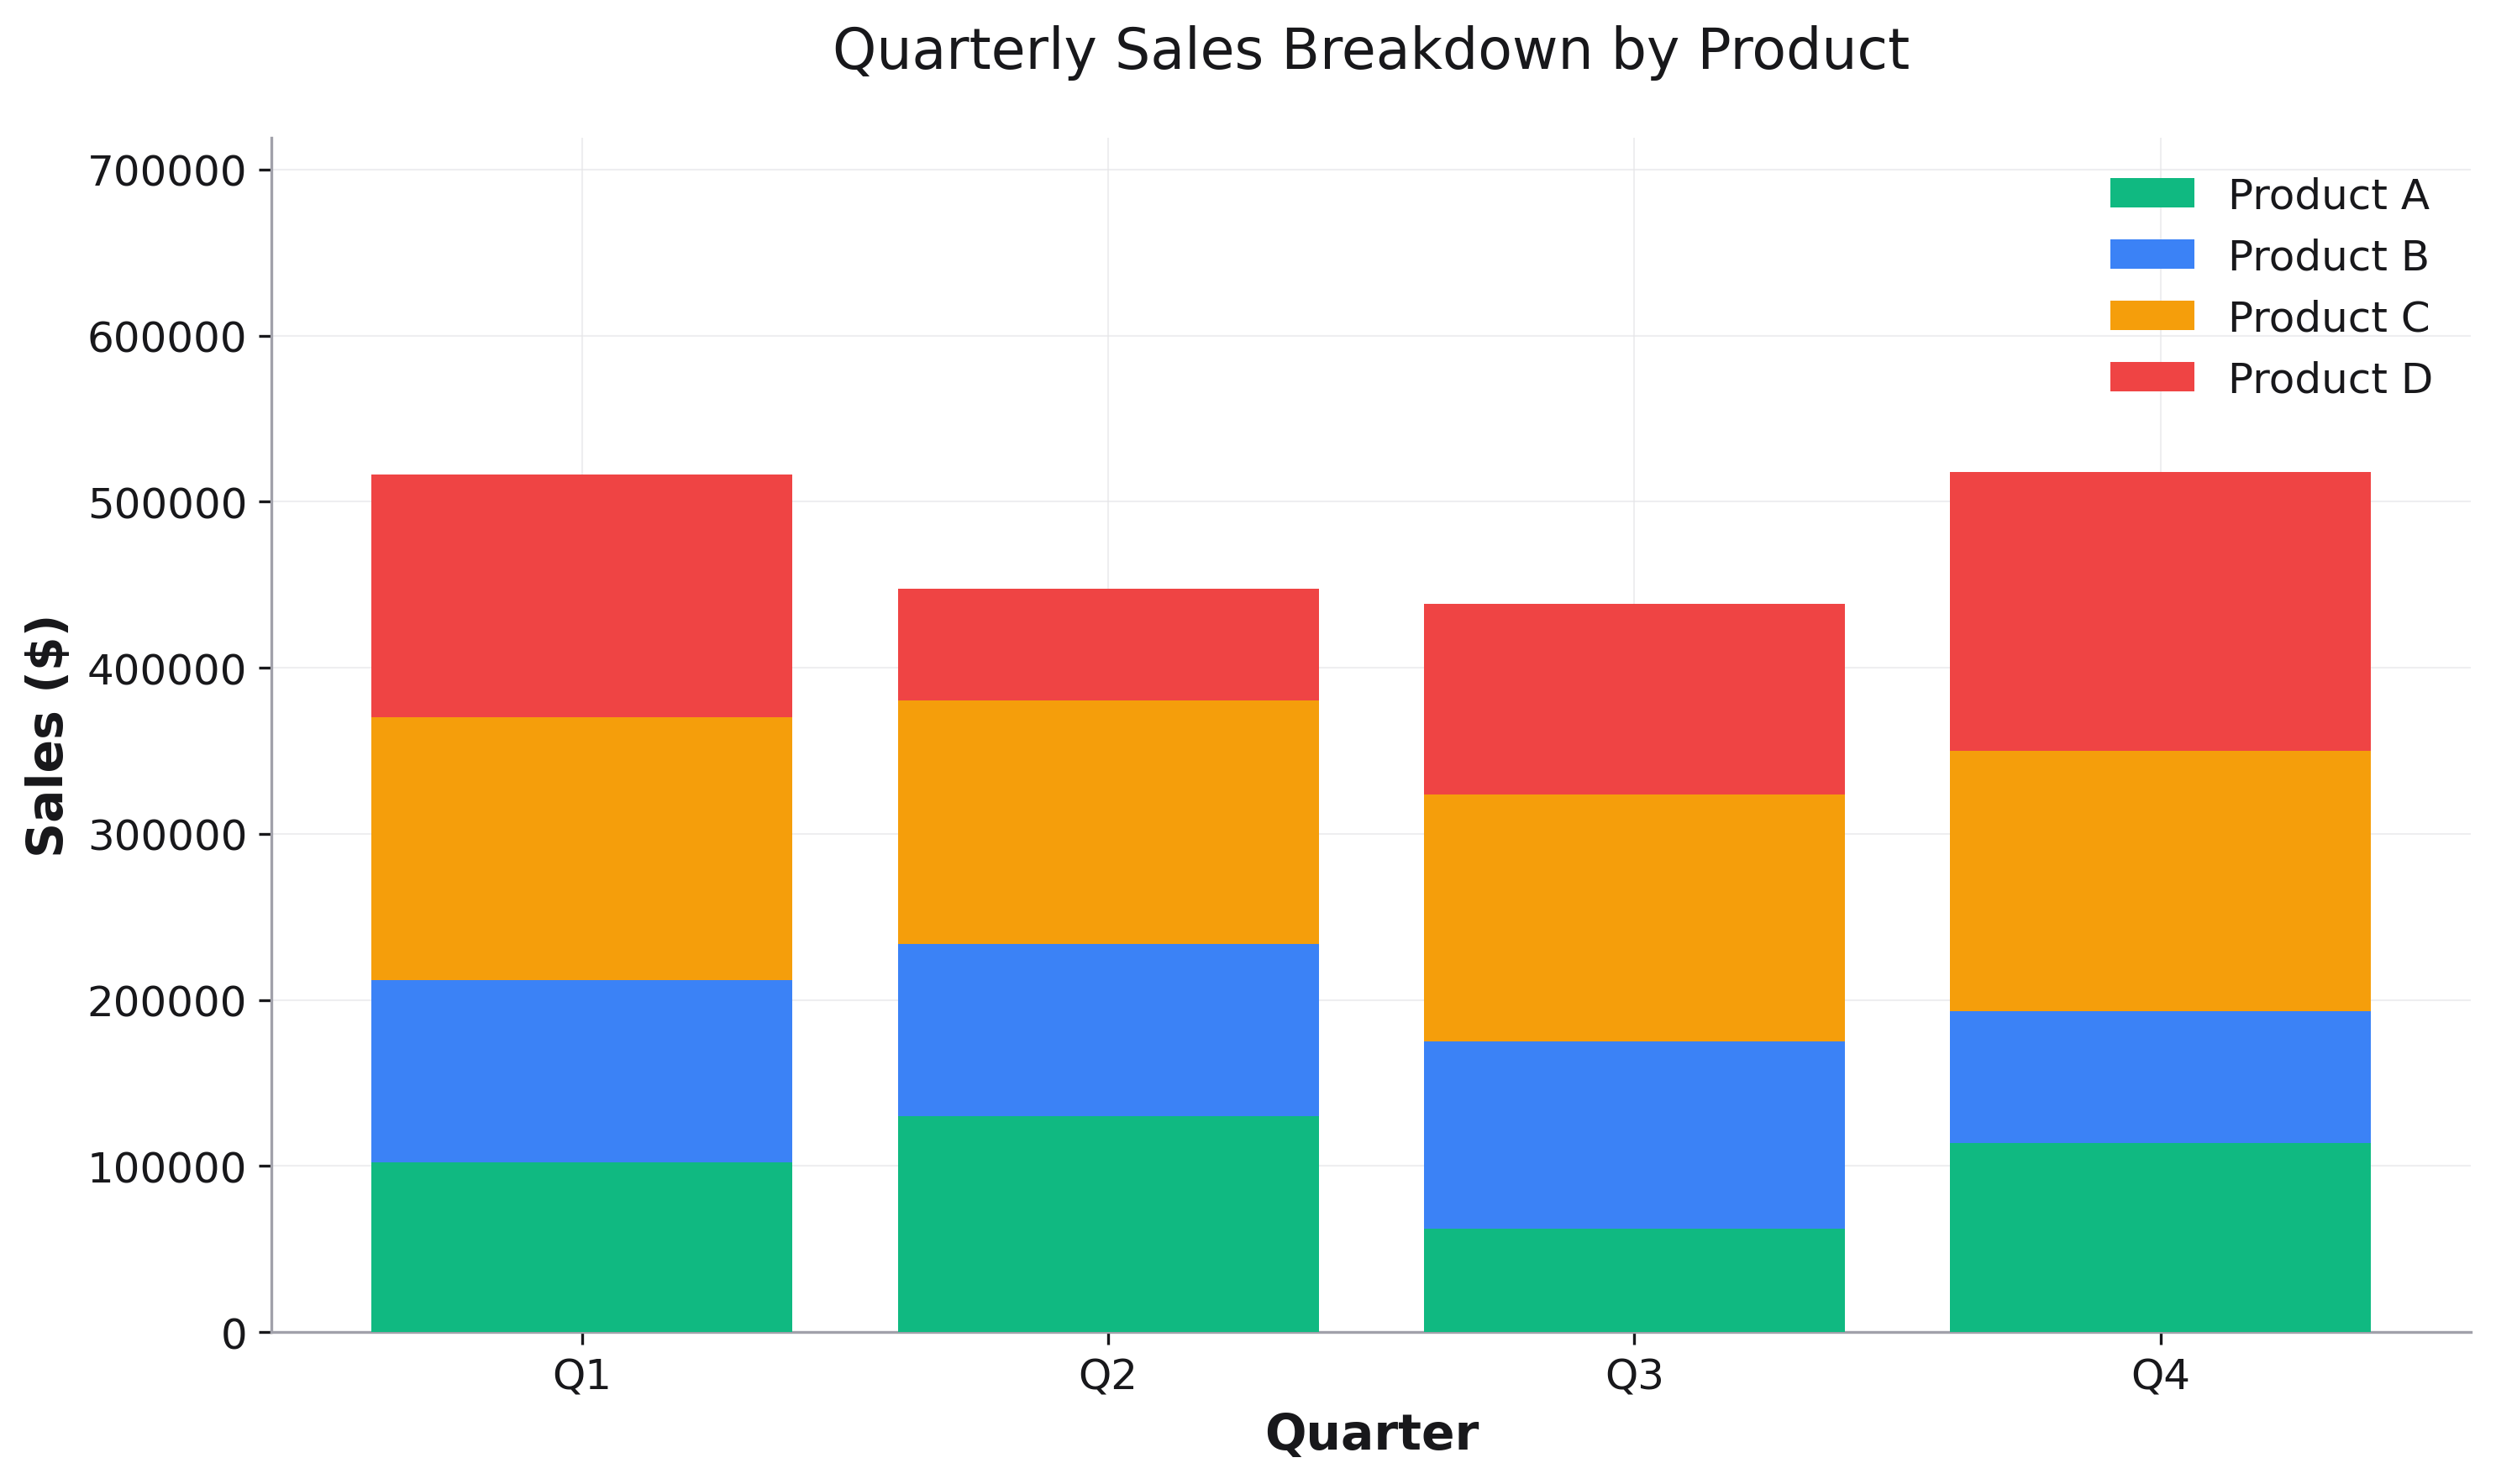
Show component contributions with stacked bars:
# Prepare data for stacking
sales_by_component = df.groupby(['month', 'component'])['sales'].sum().reset_index()

fig = rk.bar(
    data=sales_by_component,
    x='month',
    y='sales',
    color='component',
    barmode="stack",
    title='Monthly Sales Breakdown by Component',
    labels={'month': 'Month', 'sales': 'Sales ($)', 'component': 'Component'}
)
Parameters
See the API Reference for complete parameter documentation.
See Also
Histograms - For continuous data distributions
Heatmaps - For 2D categorical data
API Reference - Complete parameter documentation