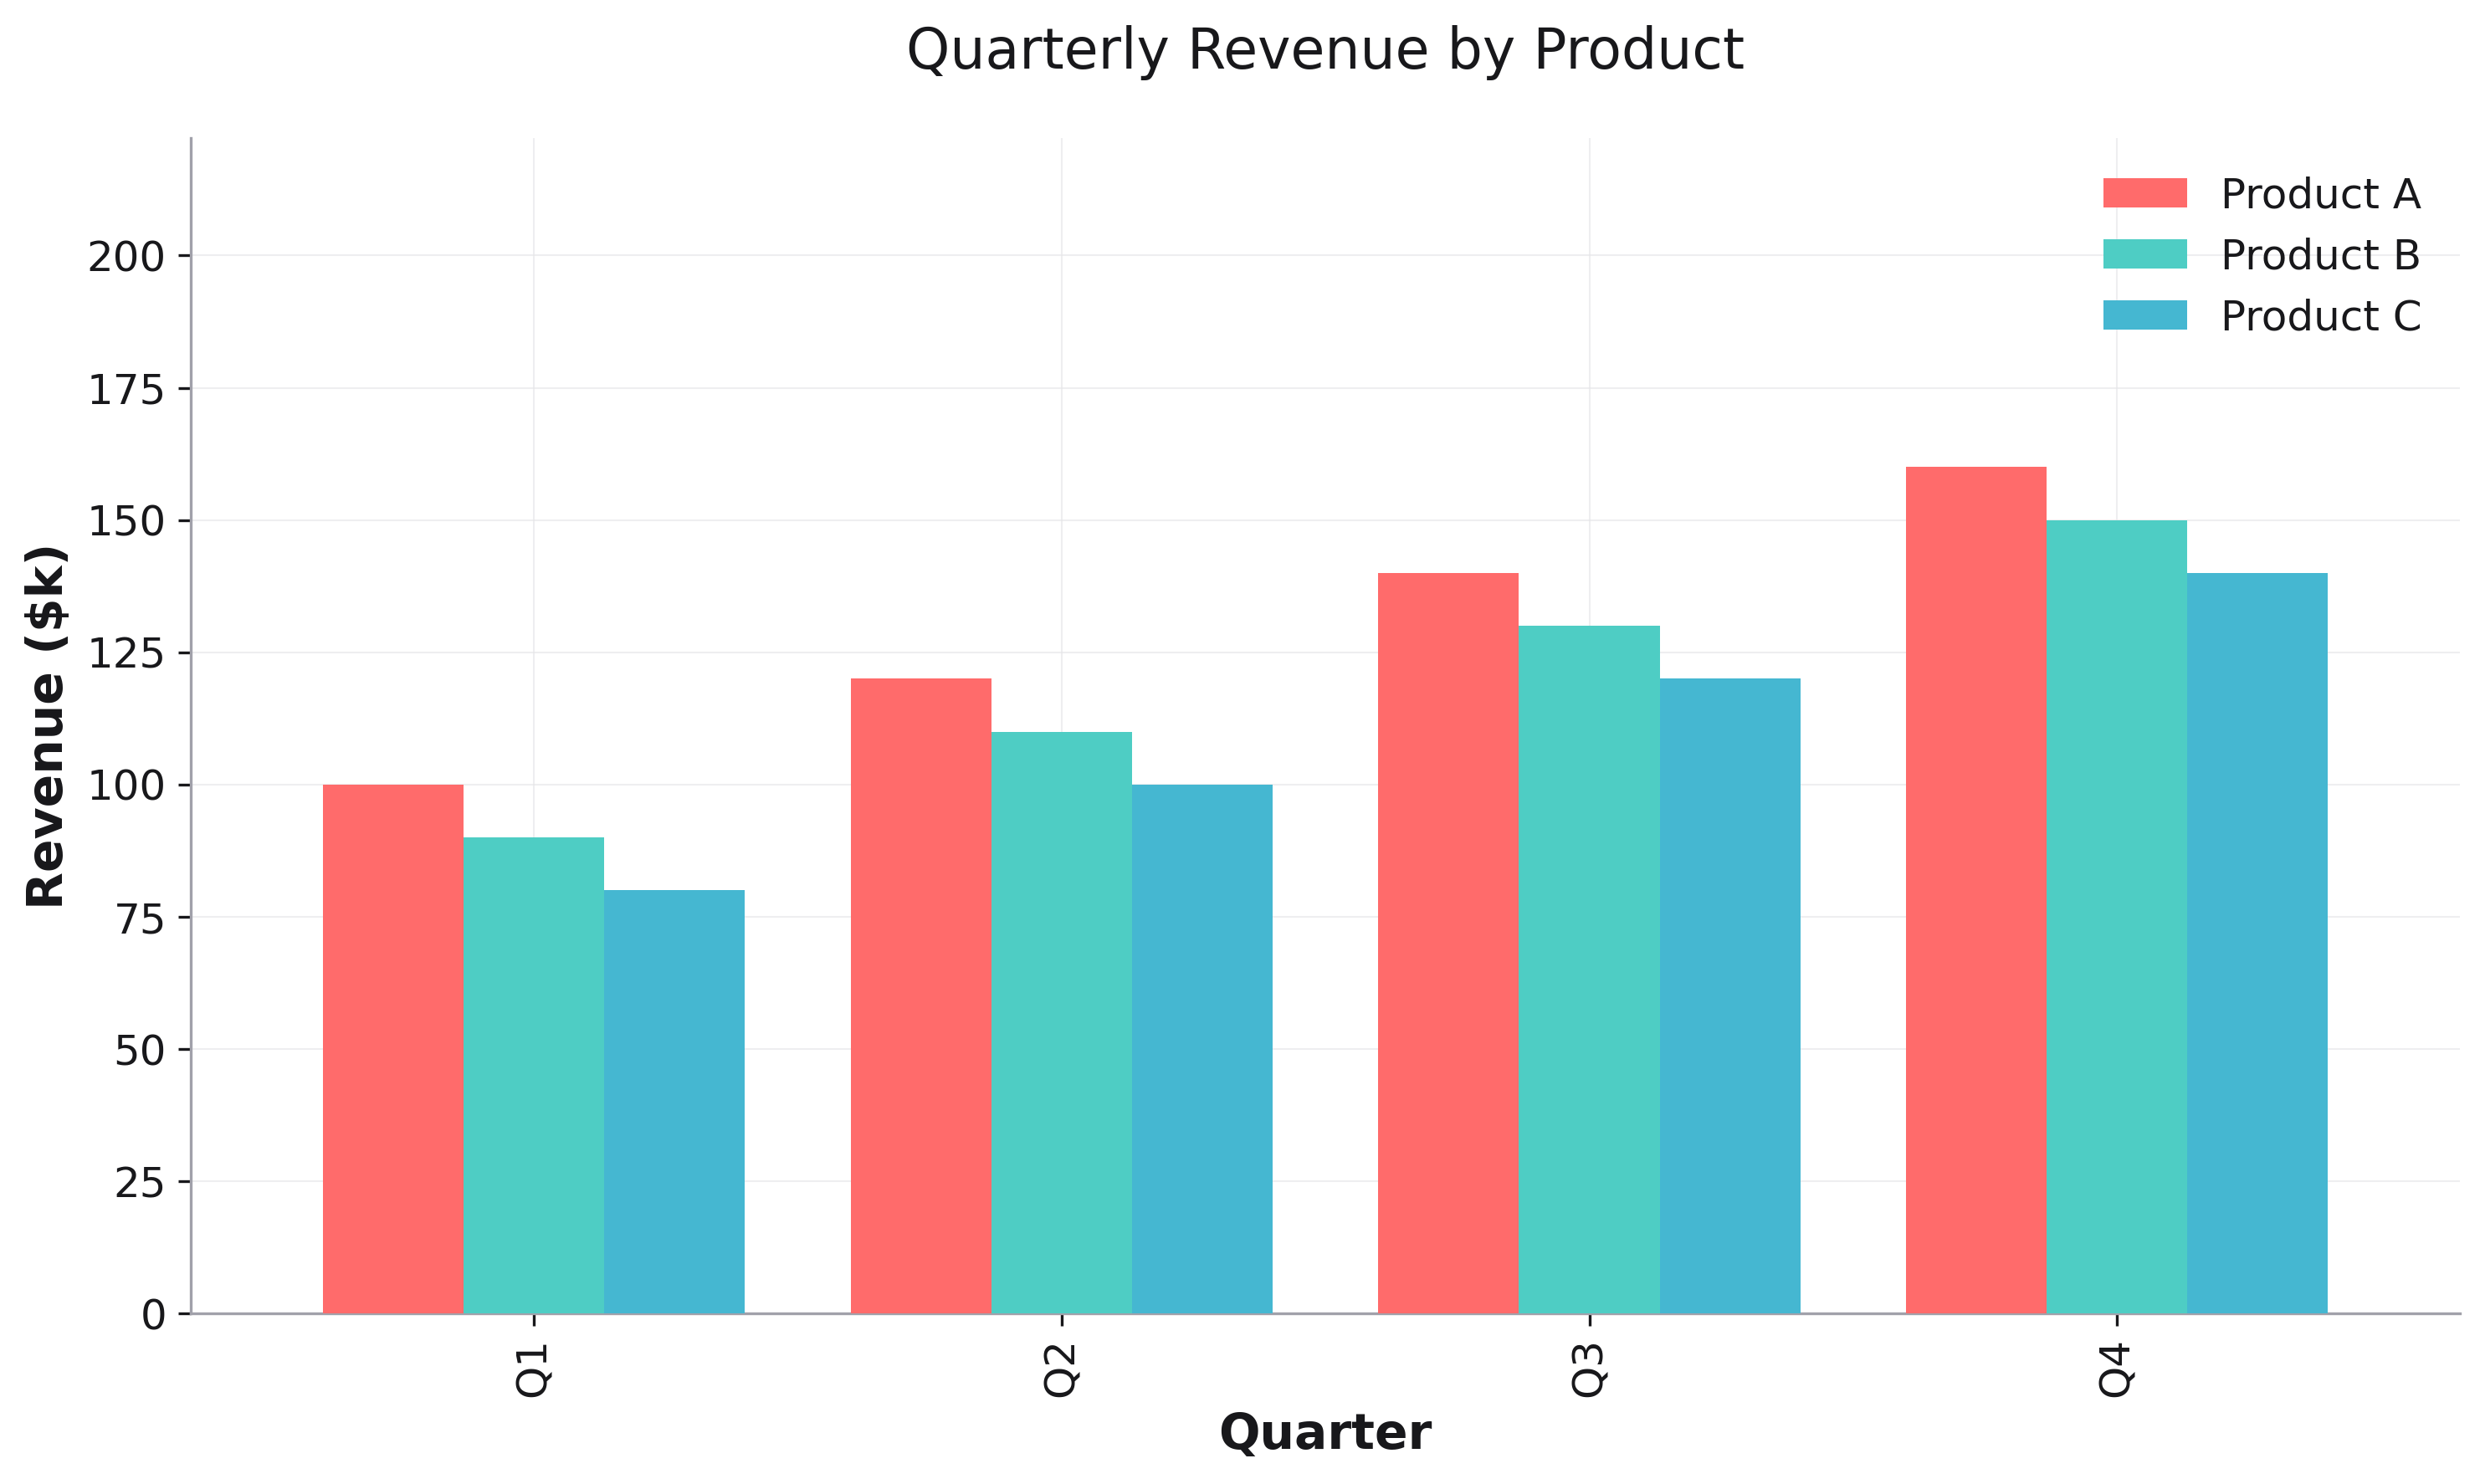
Consistent Colors and Ordering
Maintain consistent colors and category ordering across multiple plots.
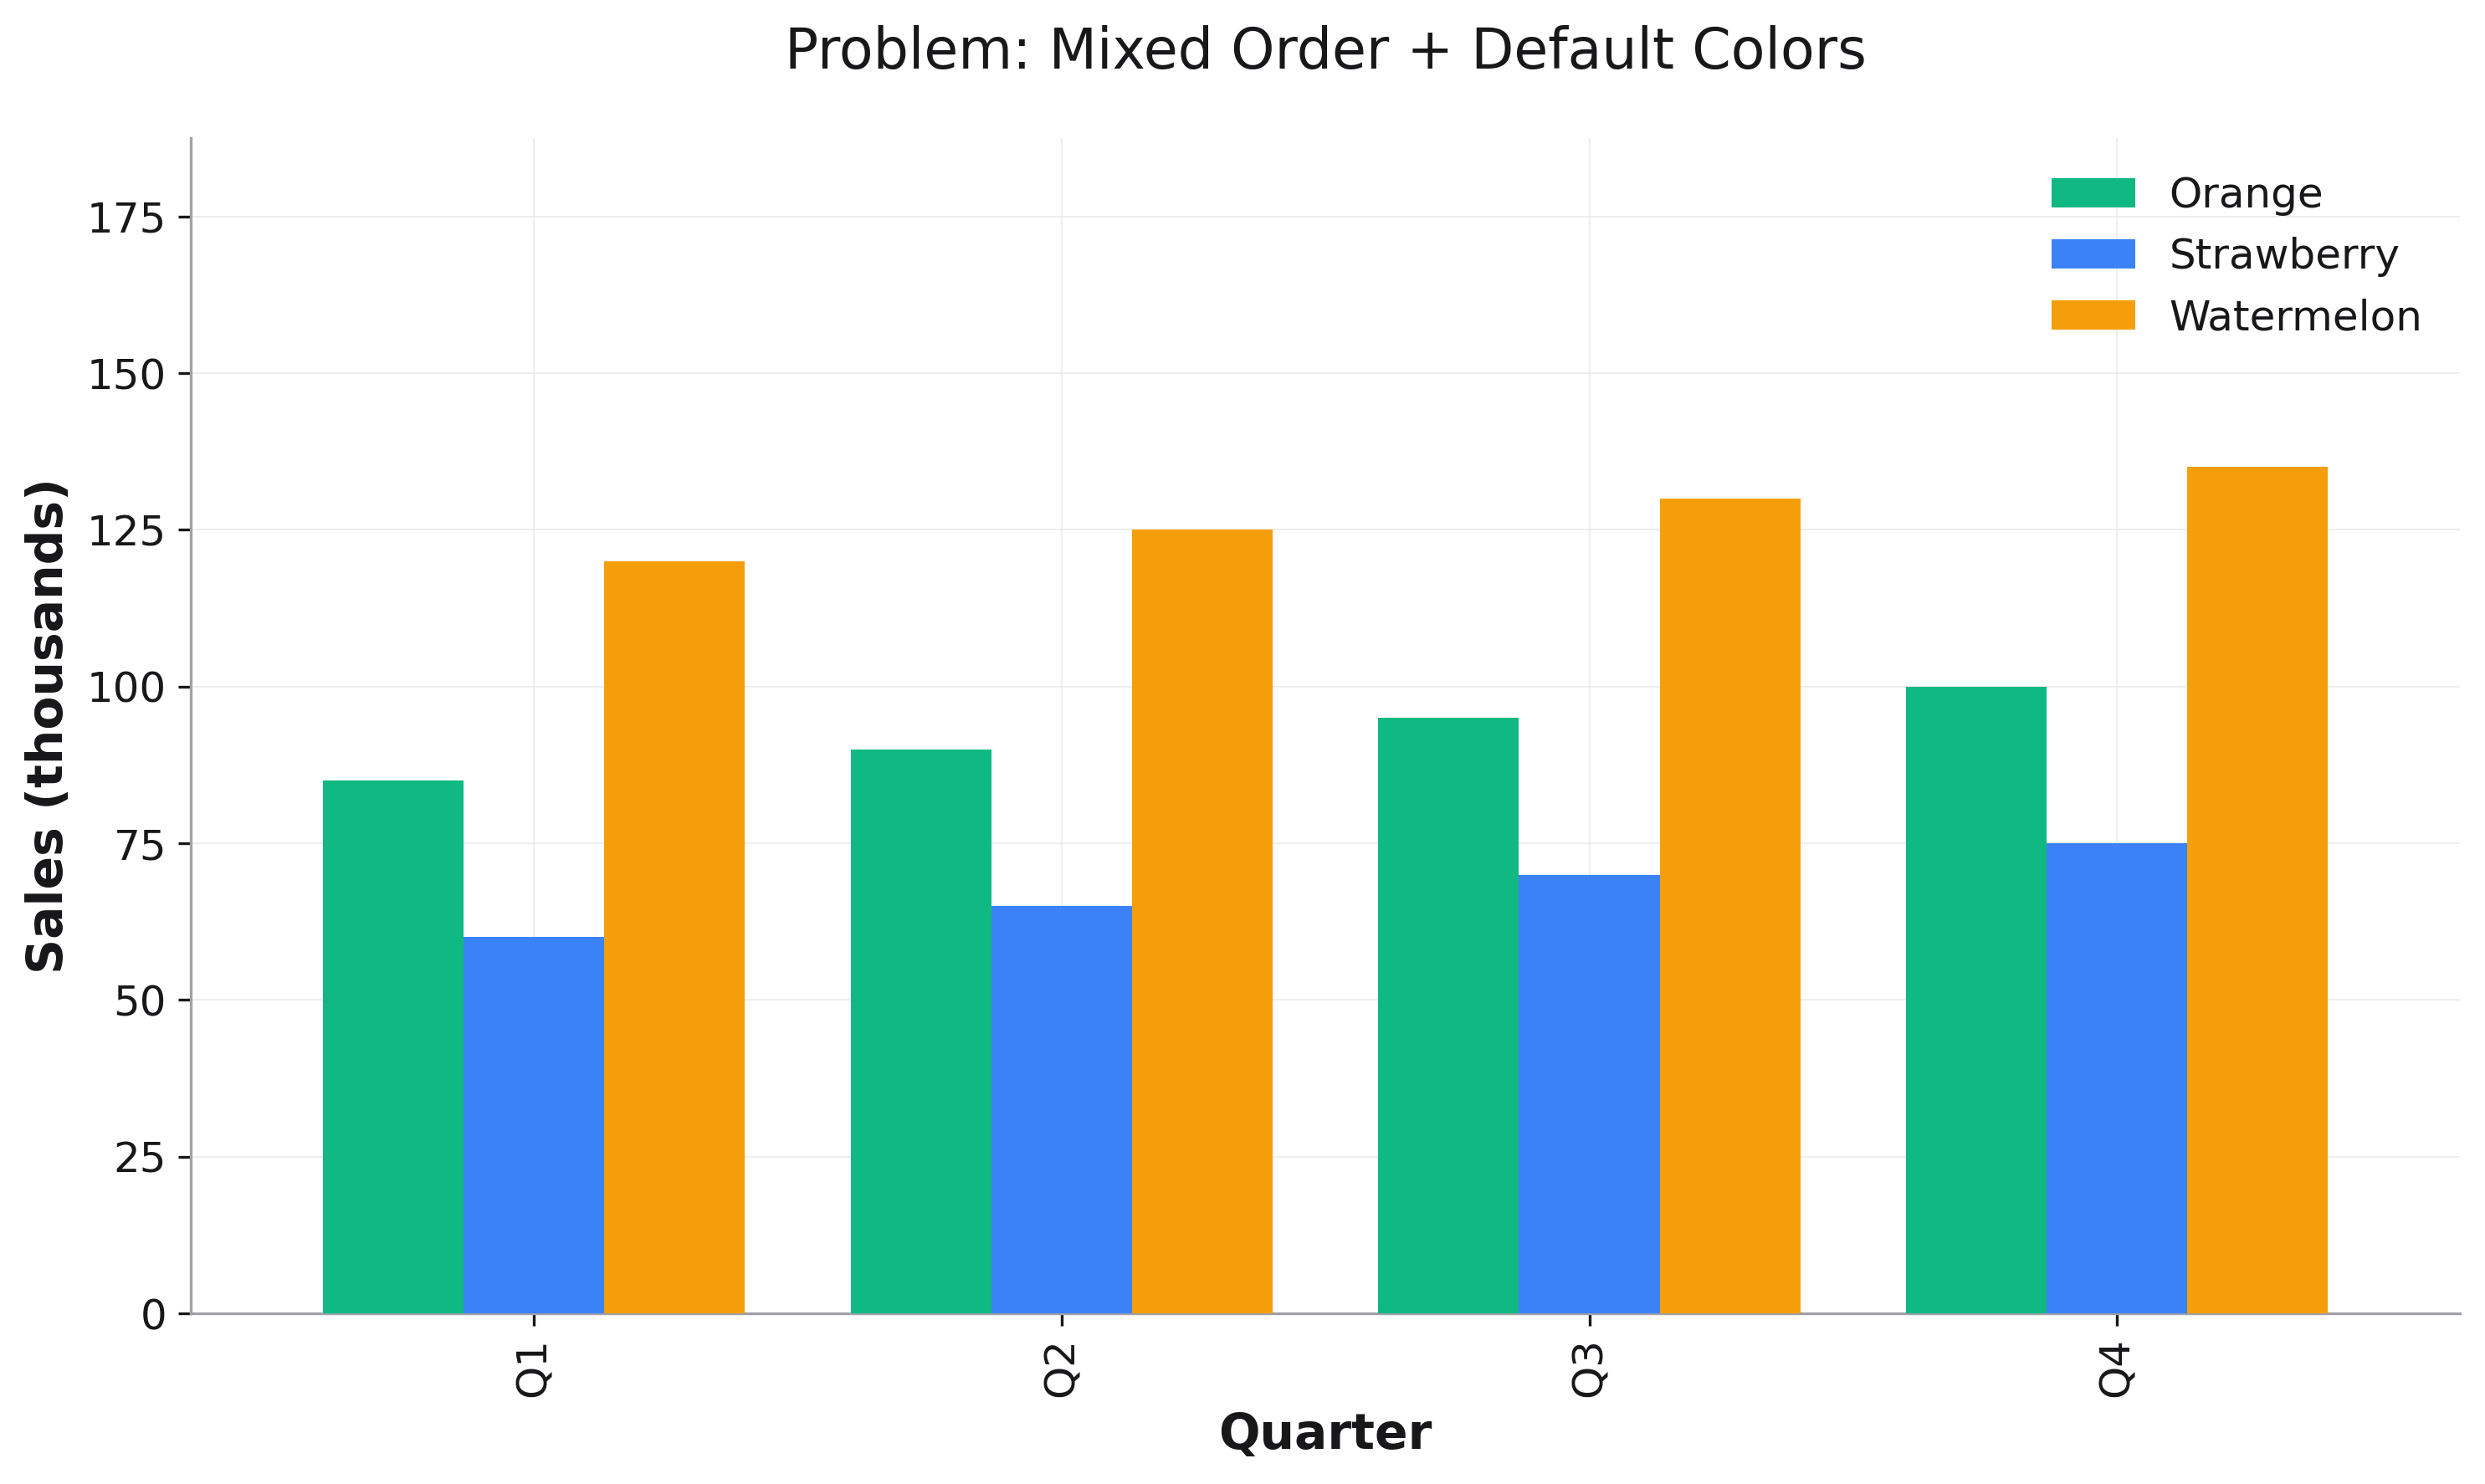
The Problem
Default colors and ordering can be confusing:
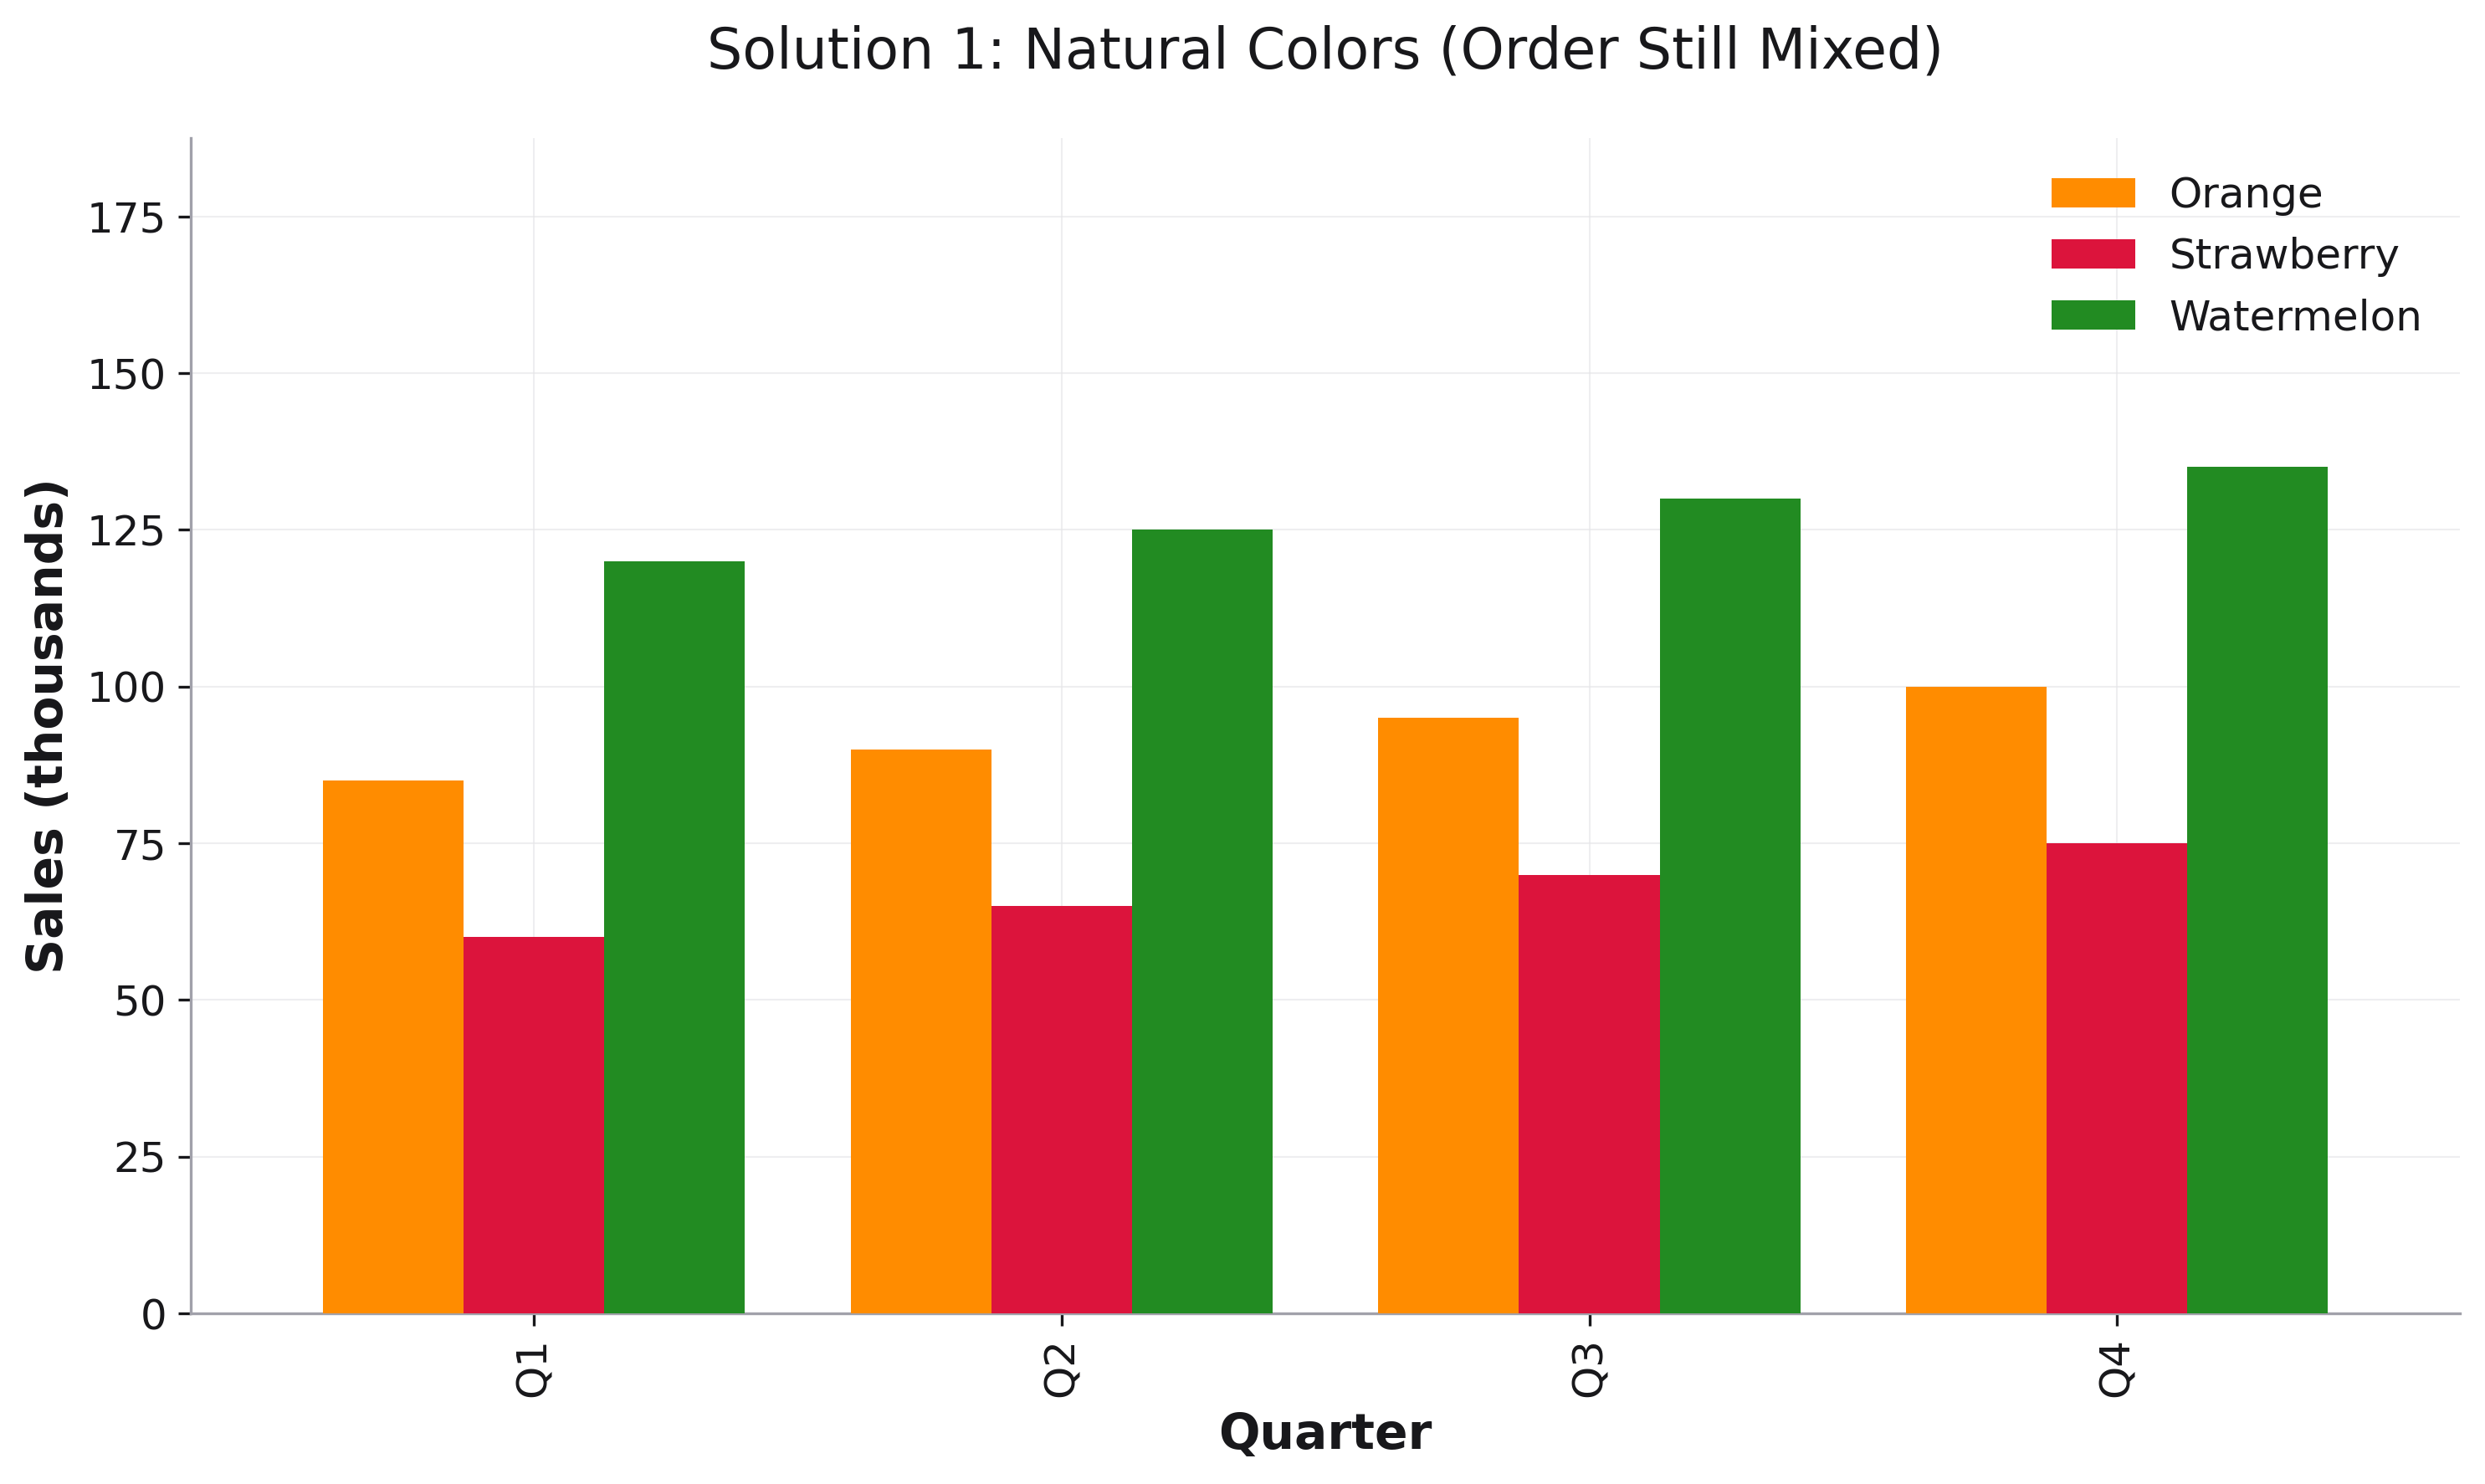
Solution 1: Fix Colors
Use color_mapping to assign meaningful colors:
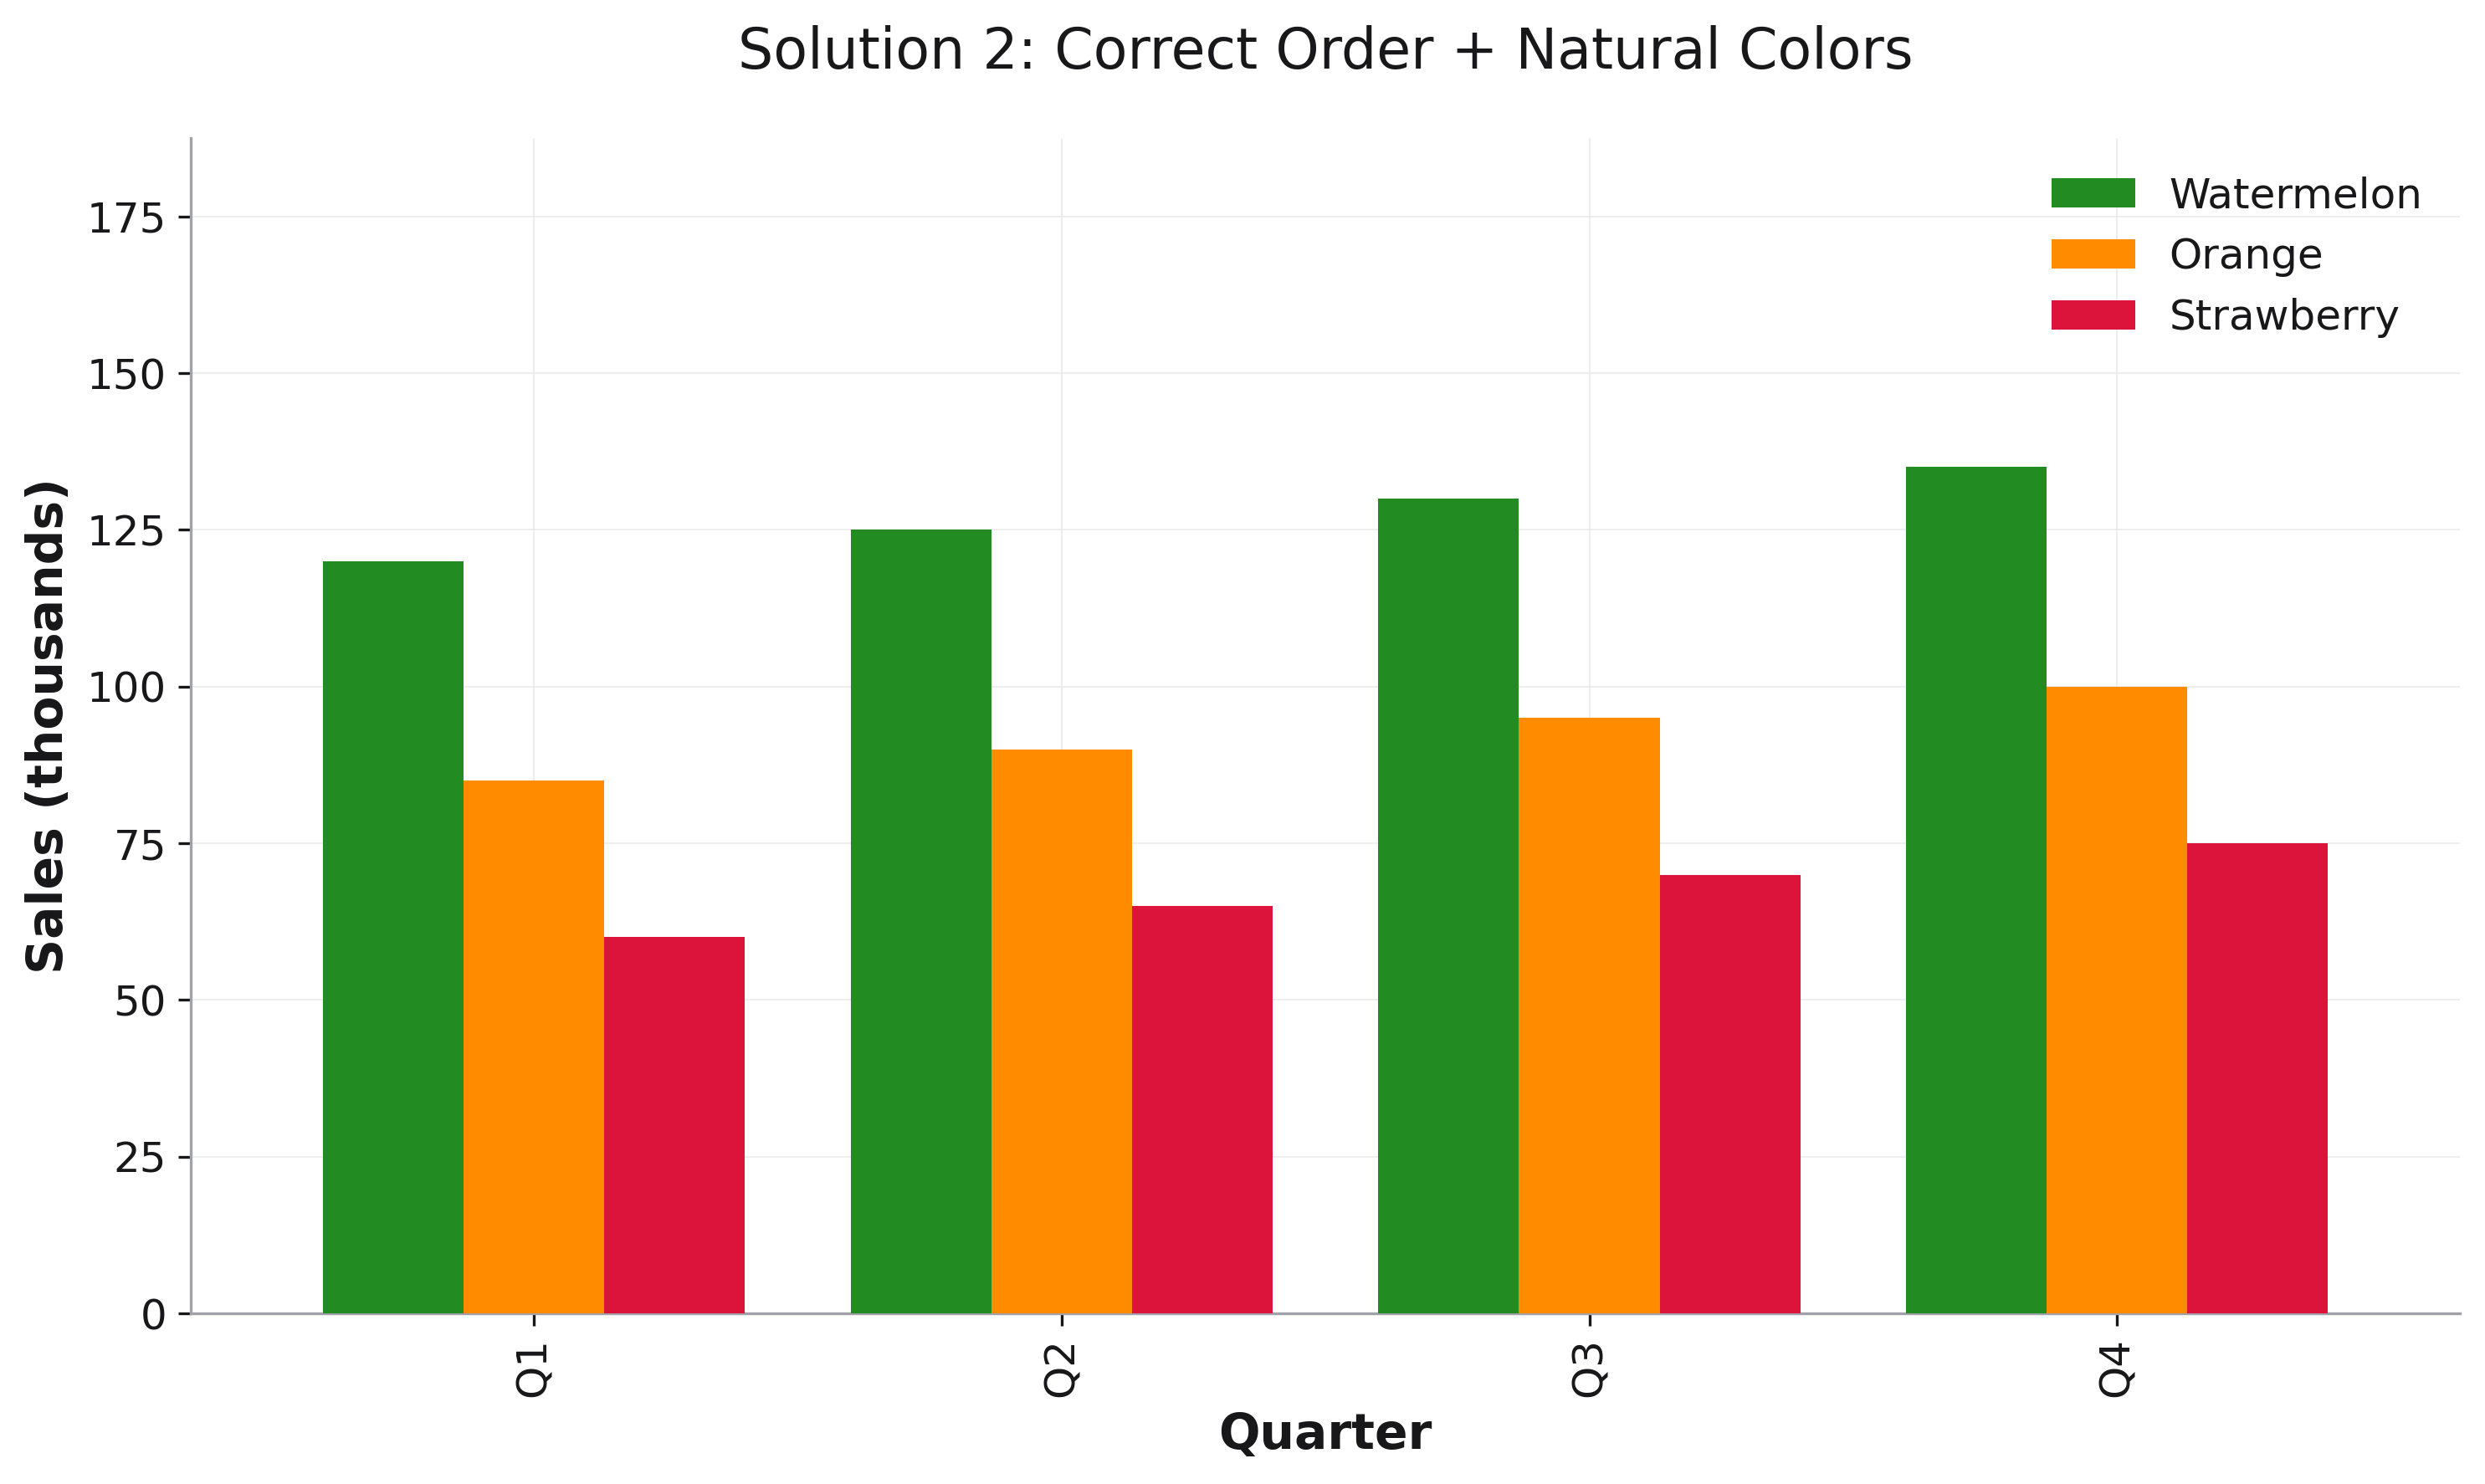
Solution 2: Fix Colors and Order
Use both color_mapping and category_order:
# Define natural colors
natural_colors = {
    'Orange': '#FF8C00',
    'Strawberry': '#DC143C',
    'Watermelon': '#228B22'
}

# Fix colors only
fig = rk.bar(df, x='quarter', y='sales', color='fruit',
             color_mapping=natural_colors)

# Fix both colors and order
fig = rk.bar(df, x='quarter', y='sales', color='fruit',
             color_mapping=natural_colors,
             category_order=['Watermelon', 'Orange', 'Strawberry'])
Works Across All Plot Types
Line Plots
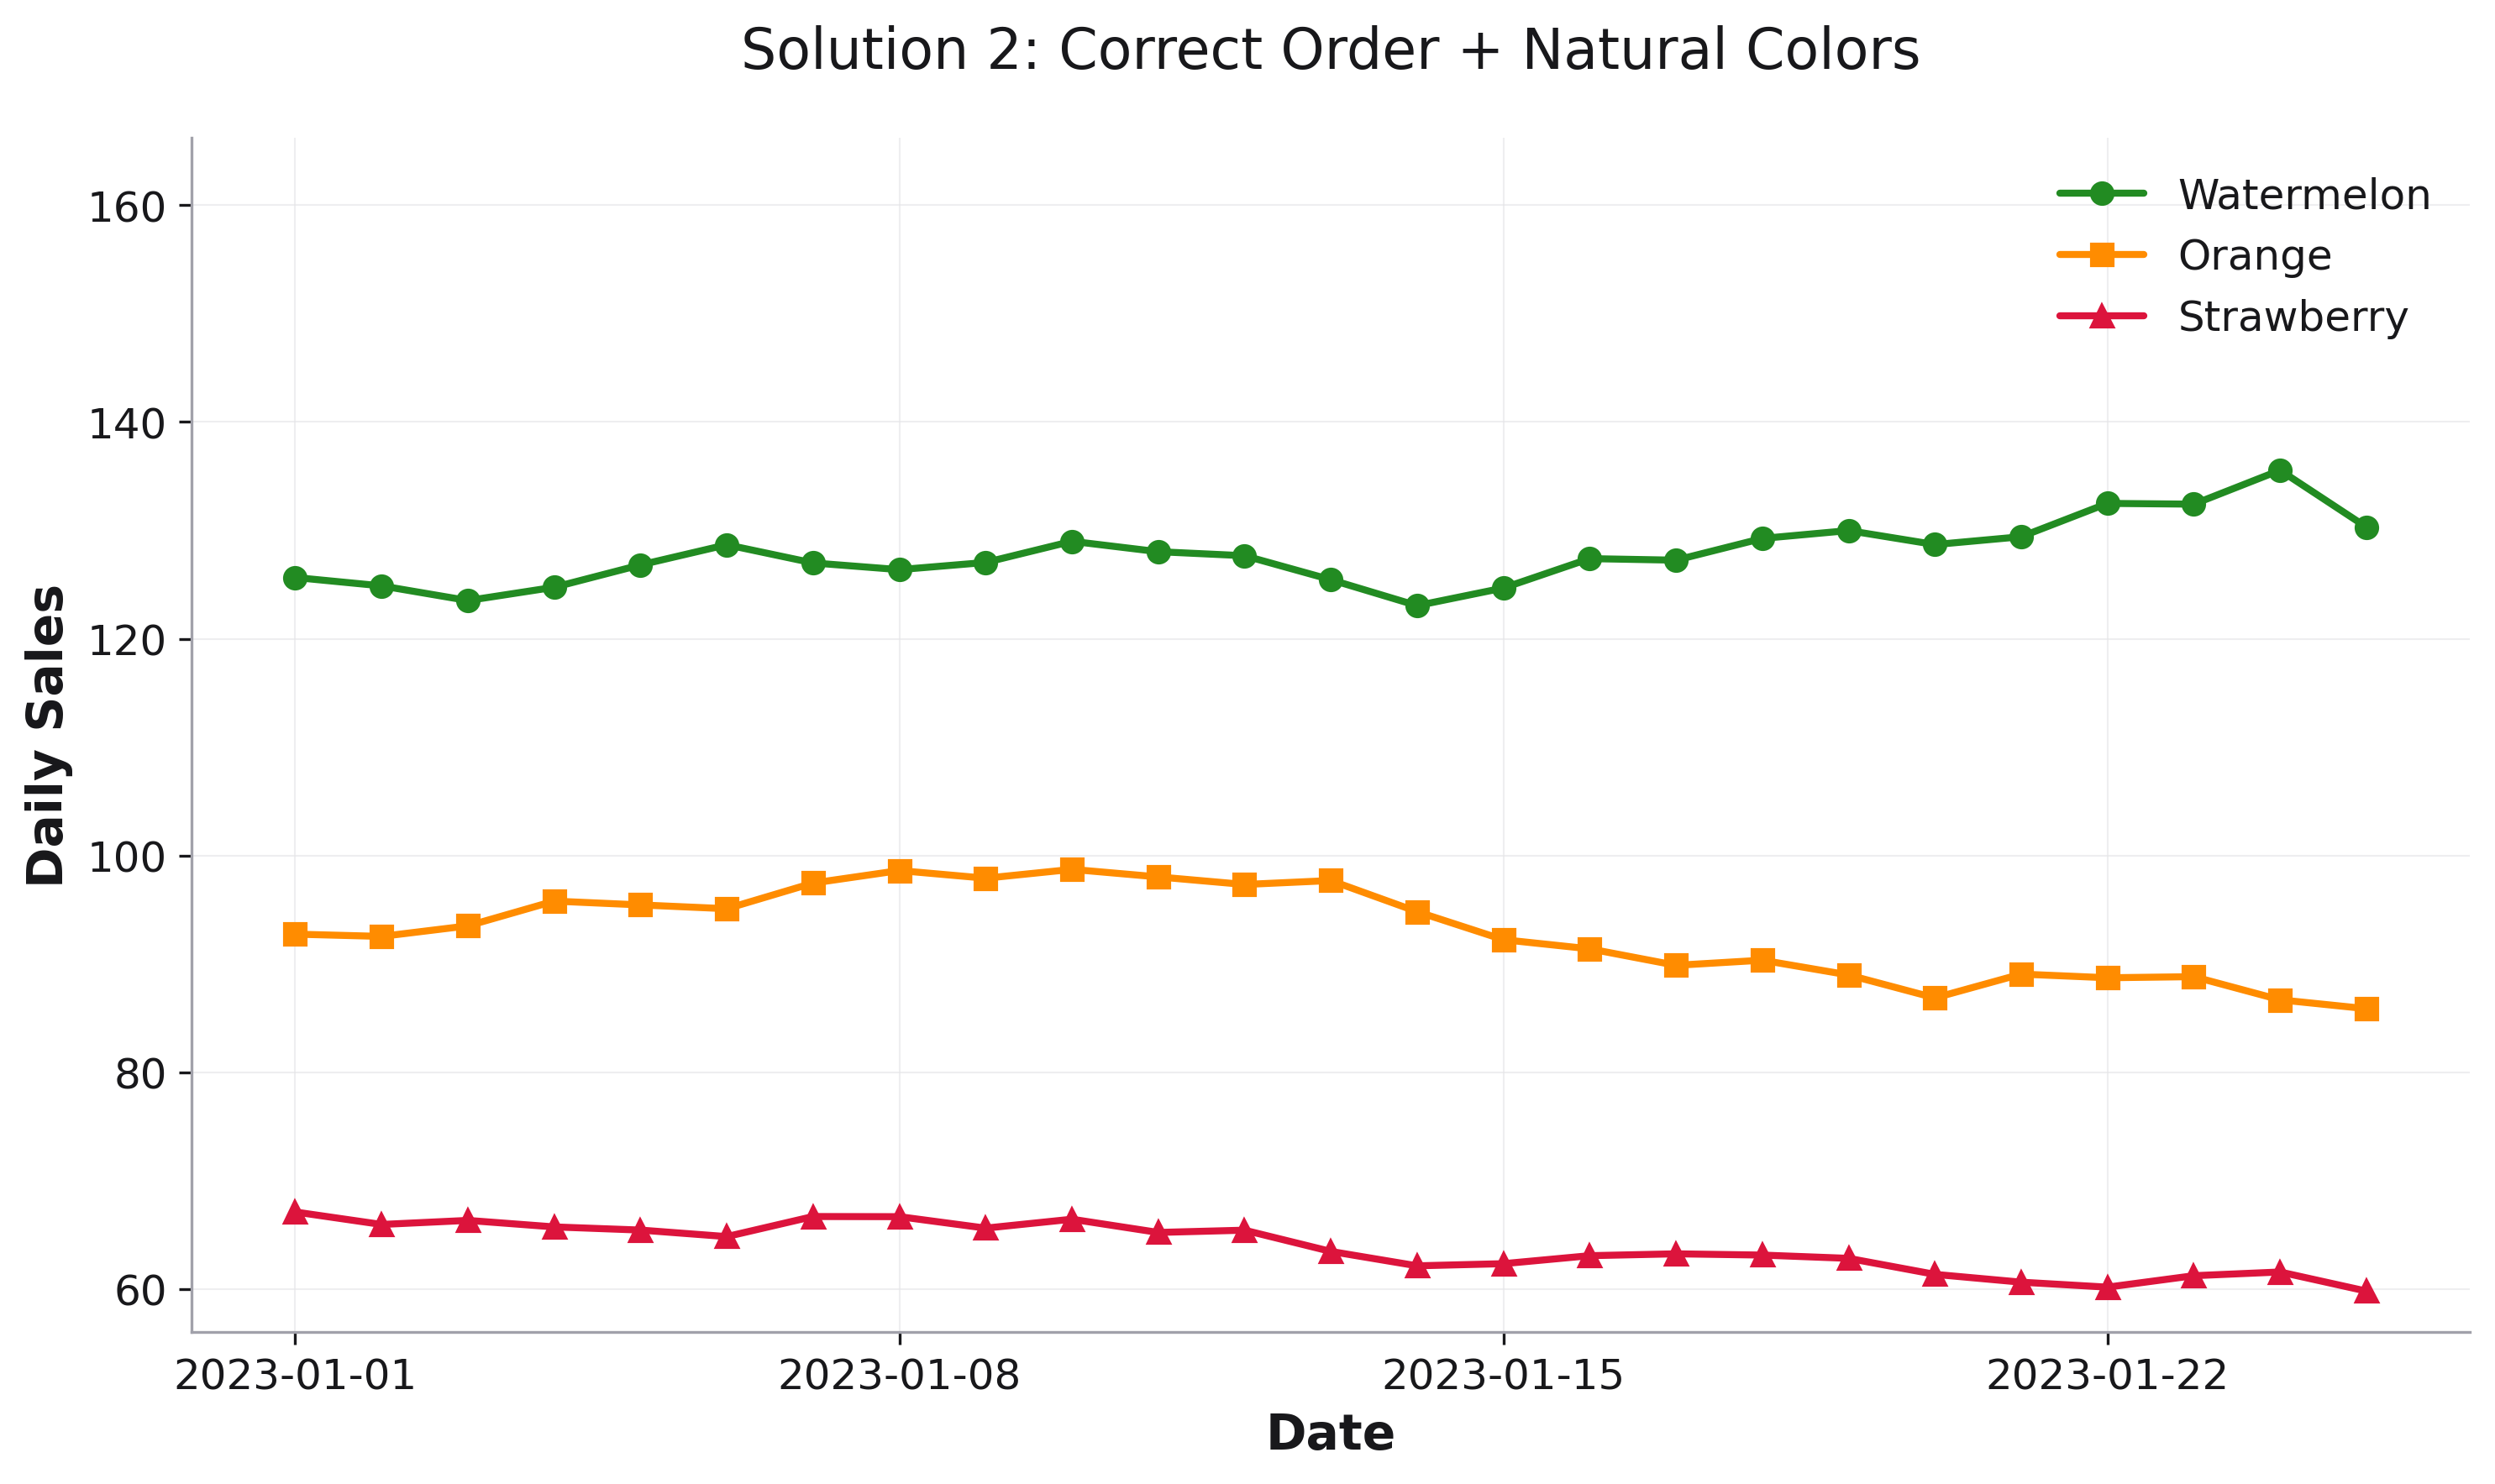
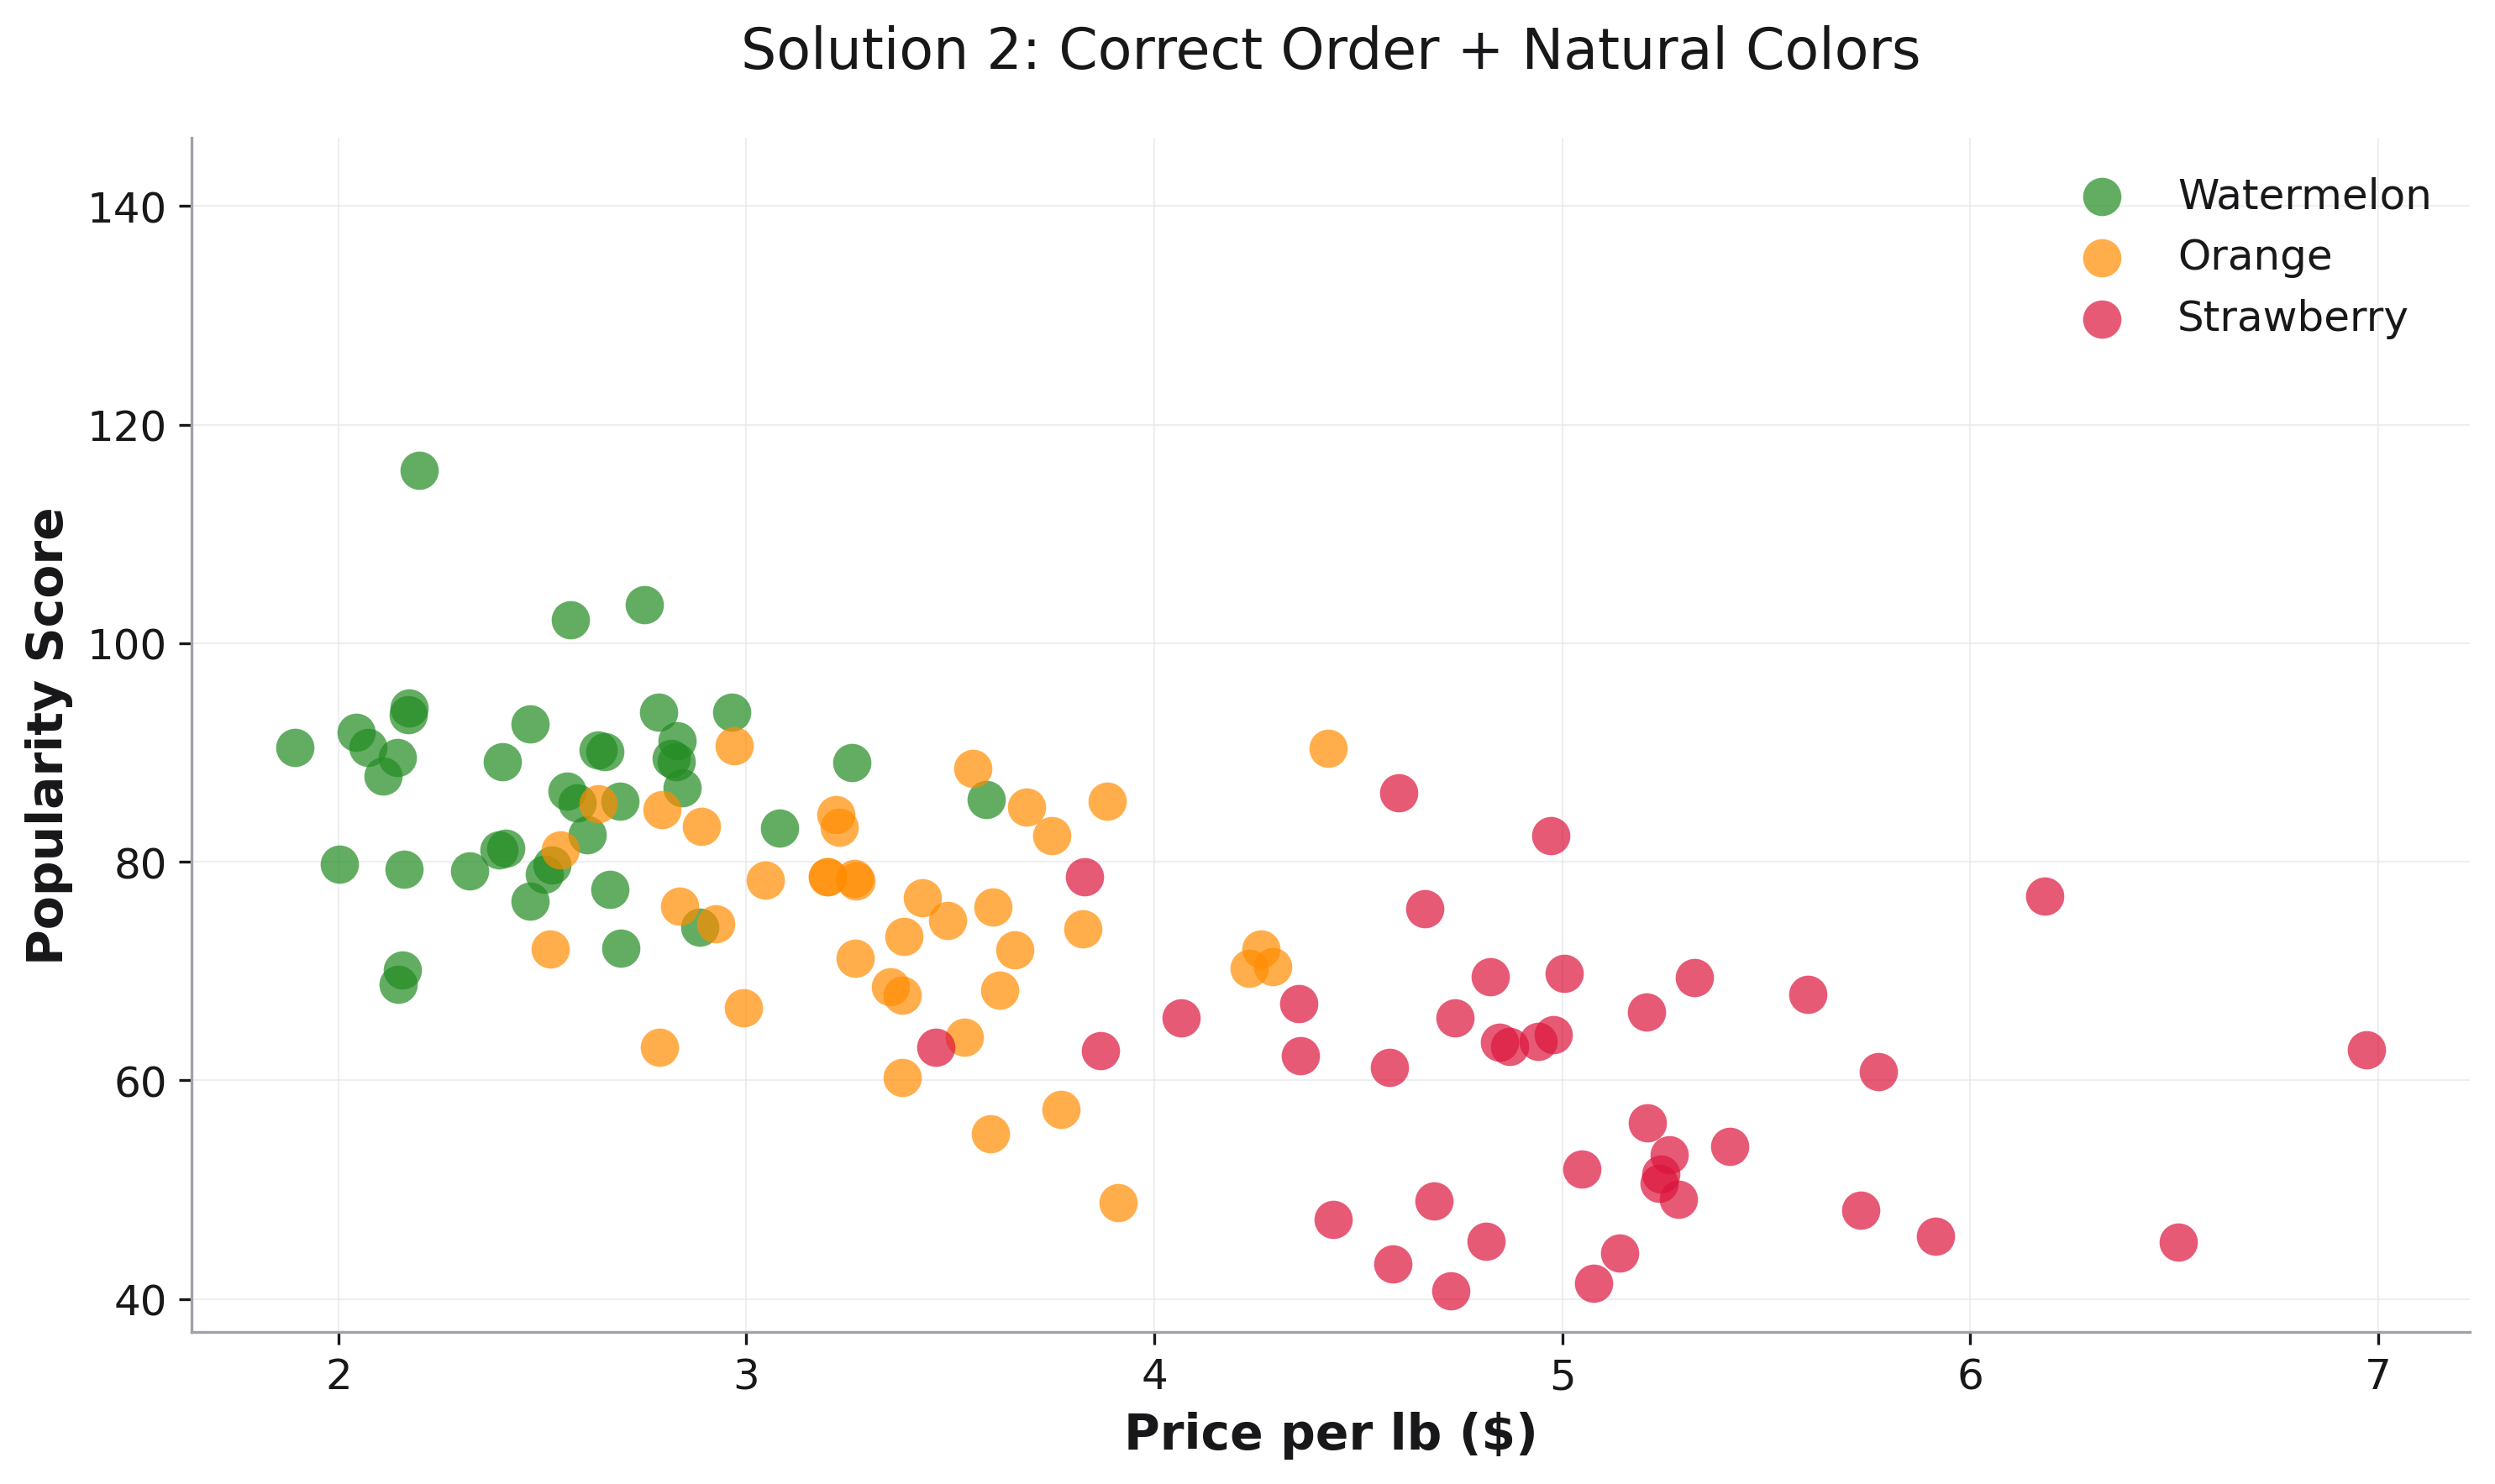
Scatter Plots
Consistent Configuration
# Define once, use everywhere
color_mapping = {
    'Control': '#95A5A6',
    'Treatment A': '#3498DB',
    'Treatment B': '#E74C3C',
    'Treatment C': '#2ECC71'
}

category_order = ['Control', 'Treatment A', 'Treatment B', 'Treatment C']

# Apply to all plots
fig1 = rk.scatter(df1, x='x', y='y', color='treatment',
                  color_mapping=color_mapping,
                  category_order=category_order)

fig2 = rk.bar(df2, x='time', y='count', color='treatment',
              color_mapping=color_mapping,
              category_order=category_order)