Microbenchmarks
Veeksha provides self-contained CLI microbenchmarks that isolate specific inference operations for precise measurement. Each microbenchmark has its own subcommand, generates results tables, CSV files, JSON output, and plots.
All microbenchmark output is written to <output_dir>/<type>/<timestamp>/
with a latest symlink for convenience.
Prefill vs decode
LLM inference has two main phases:
- Prefill (Prompt Processing)
Processing all input tokens to populate the KV cache. Compute-bound, scales with prompt length.
- Decode (Token Generation)
Generating output tokens one at a time. Memory-bandwidth bound, scales with batch size.
Measuring these separately helps identify bottlenecks. The stress microbenchmark then characterizes the full throughput-vs-latency tradeoff under load.
Prefill microbenchmark
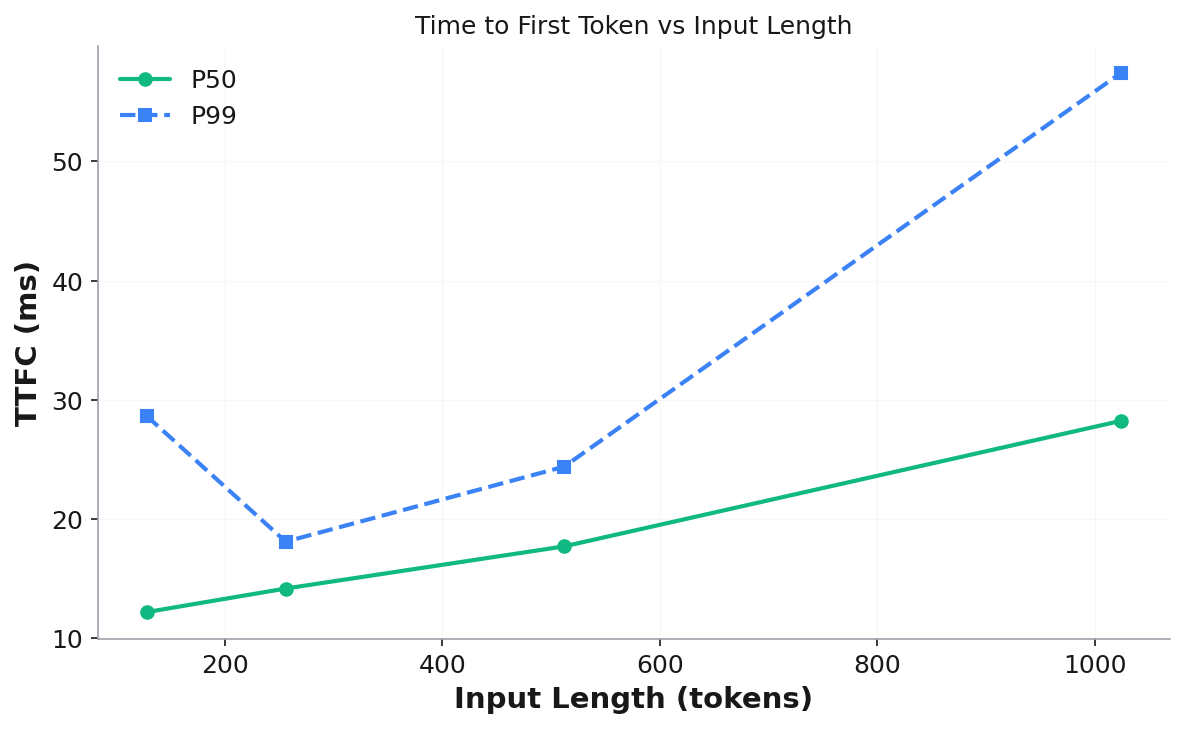
Measures Time to First Token (TTFC) across input lengths by sending one request at a time with minimal output tokens.
uvx -p 3.14t veeksha prefill \
    --api_base http://localhost:8000/v1 \
    --model meta-llama/Llama-3-8B-Instruct \
    --input_lengths 128 256 512 1024 2048 \
    --output_tokens 1 \
    --samples_per_length 10 \
    --output_dir microbench_output
Key parameters:
--input_lengthsList of prompt lengths to sweep. Requests are generated using a stair pattern (
samples_per_lengthrequests per length).--output_tokensNumber of output tokens per request (default: 1). Keep minimal to isolate prefill.
--samples_per_lengthRepetitions per input length for statistical stability.
Output files:
prefill_results.json— structured results with TTFC stats per lengthprefill_results.csv— tabular format for downstream analysisplots/ttfc_vs_input_length.png— TTFC P50/P99 vs input length
Validation checks: session count, output token count, sequential execution, prompt token stair pattern.
Decode microbenchmark
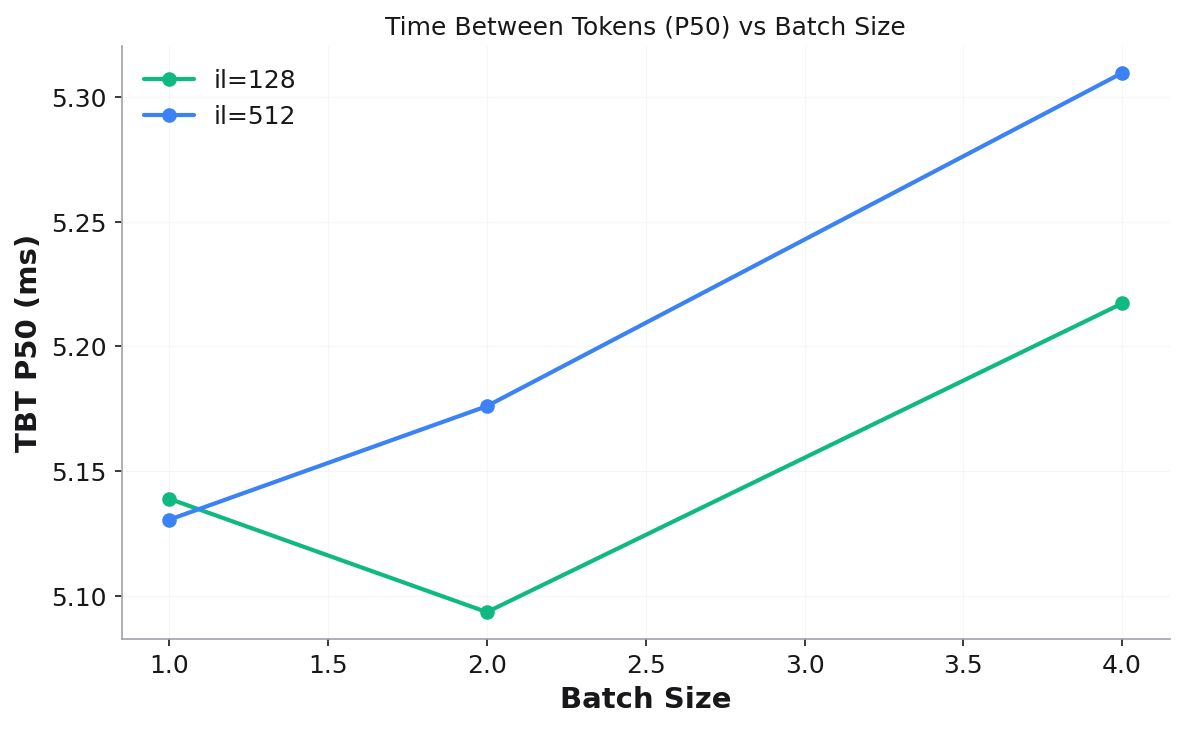
Measures Time Between Tokens (TBT) across batch sizes and input lengths using decode window analysis to isolate steady-state decode performance.
uvx -p 3.14t veeksha decode \
    --api_base http://localhost:8000/v1 \
    --model meta-llama/Llama-3-8B-Instruct \
    --batch_sizes 1 2 4 8 16 \
    --input_lengths 128 512 \
    --samples_per_length 20 \
    --engine_chunk_size 512 \
    --output_dir microbench_output
Key parameters:
--batch_sizesConcurrent request counts. Each (batch_size, input_length) pair runs as a separate benchmark. Requests are launched sequentially so that the first request enters decode before the last finishes prefilling.
--input_lengthsPrompt lengths to test at each batch size.
--engine_chunk_sizeEngine’s iteration budget (tokens per step). Used to compute how many output tokens the first request needs to still be decoding when the last request finishes prefilling.
Output files:
decode_results.json— TBT stats per (batch_size, input_length)decode_results.csv— tabular formatplots/tbt_p50_vs_batch_size.png— TBT P50 vs batch size (one line per input length)plots/tbt_p99_vs_batch_size.png— TBT P99 vs batch size
Validation checks: matching requests per input length, FCFS ordering, decode window overlap (sufficient samples in steady-state).
Stress microbenchmark
Measures throughput-vs-latency tradeoff curves by running a fixed workload (single input/output length) at increasing concurrency levels. Inspired by InferenceX.
The stress microbenchmark supports three modes: manual, range, and auto.
Manual mode
Specify exact concurrency levels:
uvx -p 3.14t veeksha stress \
    --api_base http://localhost:8000/v1 \
    --model meta-llama/Llama-3-8B-Instruct \
    --input_length 512 --output_length 256 \
    --mode.type manual \
    --mode.concurrency_levels 1 2 4 8 16 32 \
    --point_duration 120 --warmup_duration 10 \
    --output_dir microbench_output
Range mode
Automatically generate log-spaced concurrency levels:
uvx -p 3.14t veeksha stress \
    --mode.type range \
    --mode.concurrency_min 1 --mode.concurrency_max 64 --mode.concurrency_points 8 \
    --input_length 512 --output_length 256 \
    --point_duration 120 --warmup_duration 10 \
    --output_dir microbench_output
Auto mode
Automatically discovers the server’s operating range using a three-phase approach:
Exponential probe — doubles concurrency (1→2→4→8→…) until throughput gain falls below
--mode.auto_throughput_threshold(default: 5%).Interactivity lower bound — finds the highest concurrency where per-user interactivity (1/TPOT) is still within threshold of the best observed. Below this, reducing concurrency yields no perceptible per-user improvement.
Fill — generates
--mode.auto_fill_pointslog-spaced levels between the bounds. Existing probe measurements that are close enough to a fill target are reused (no redundant runs).
uvx -p 3.14t veeksha stress \
    --api_base http://localhost:8000/v1 \
    --model meta-llama/Llama-3-8B-Instruct \
    --input_length 512 --output_length 256 \
    --mode.type auto \
    --mode.auto_max_probes 10 --mode.auto_fill_points 10 \
    --point_duration 300 --warmup_duration 30 \
    --output_dir microbench_output
Resuming a previous run:
Auto mode supports --mode.resume_dir to reuse results from a prior run. This
avoids re-running concurrency levels that have already been measured:
uvx -p 3.14t veeksha stress \
    --mode.type auto \
    --mode.resume_dir microbench_output/stress/2026-03-07_23-07-30 \
    --point_duration 300 --warmup_duration 30 \
    --output_dir microbench_output
Resumed results are symlinked into the new run directory.
Stress parameters
--input_length/--output_lengthFixed workload shape (single values, not lists).
--point_durationSeconds to run each concurrency level (default: 120). Use 300 for production characterization.
--warmup_durationSeconds to discard at the start of each point (default: 10). Requests completing before
min(dispatched_at) + warmupare excluded.--traffic_modefixed-clients(default) — closed-loop with N concurrent clients.fixed-rate— open-loop with Poisson arrivals at N req/s.
Stress metrics
Each concurrency level produces:
Input/Output Throughput (tok/s) — system-level token throughput
E2E Latency P50/P99 — end-to-end request latency
TTFC P50/P99 — time to first token under load
Interactivity P50/P99 — per-user decode speed (1/TPOT, tok/s/user)
Stress output
Results table printed to console:
┃ Conc… ┃ In Tput ┃ Out Tput ┃ E2E P50 ┃ E2E P99 ┃ TTFC P50 ┃ Intrctvty ┃ Reqs ┃
Files:
stress_results.json— full structured resultsstress_results.csv— all metrics in tabular formatplots/— seven visualization plots:
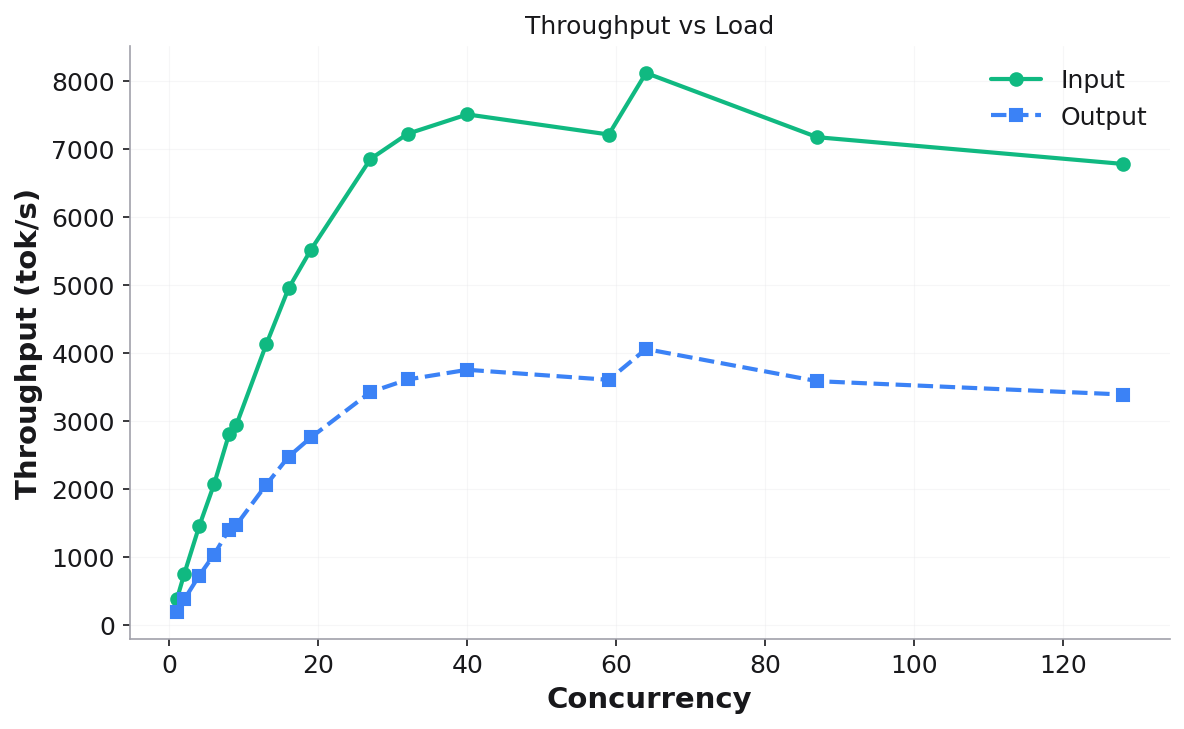
Throughput vs Load — system throughput (input + output) as concurrency increases:
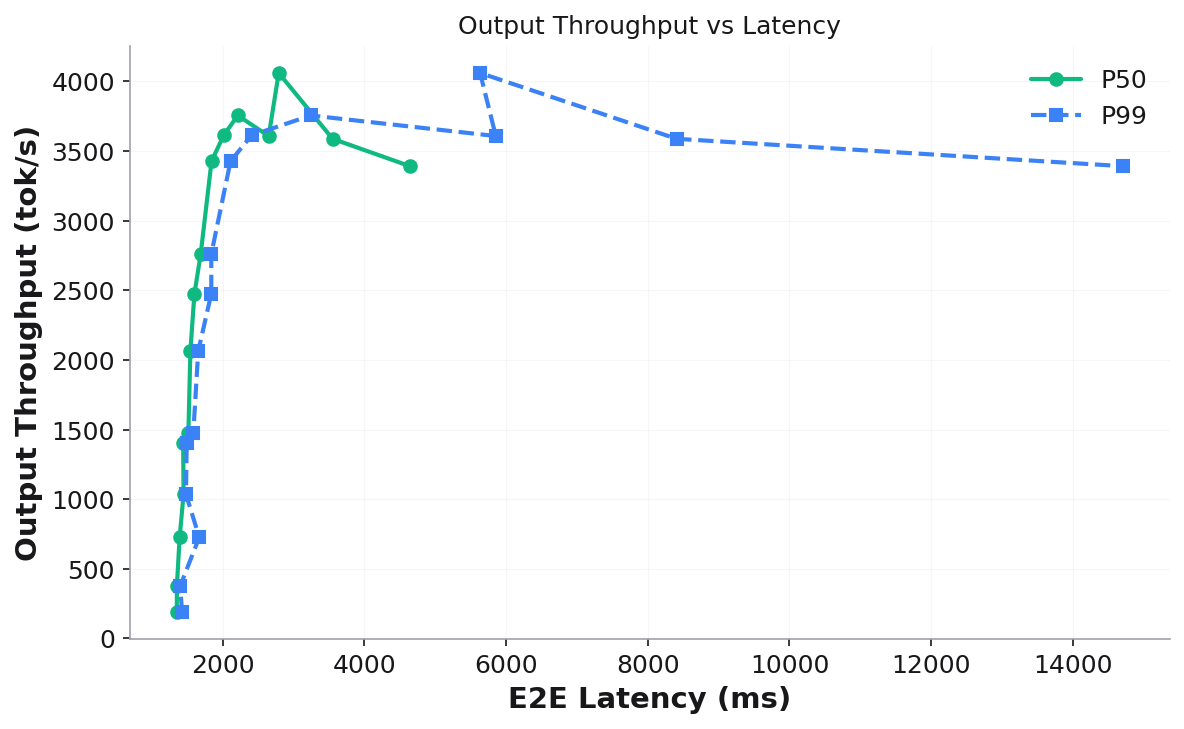
Output Throughput vs Latency — the classic throughput-latency tradeoff curve (throughput on Y-axis, latency on X-axis):
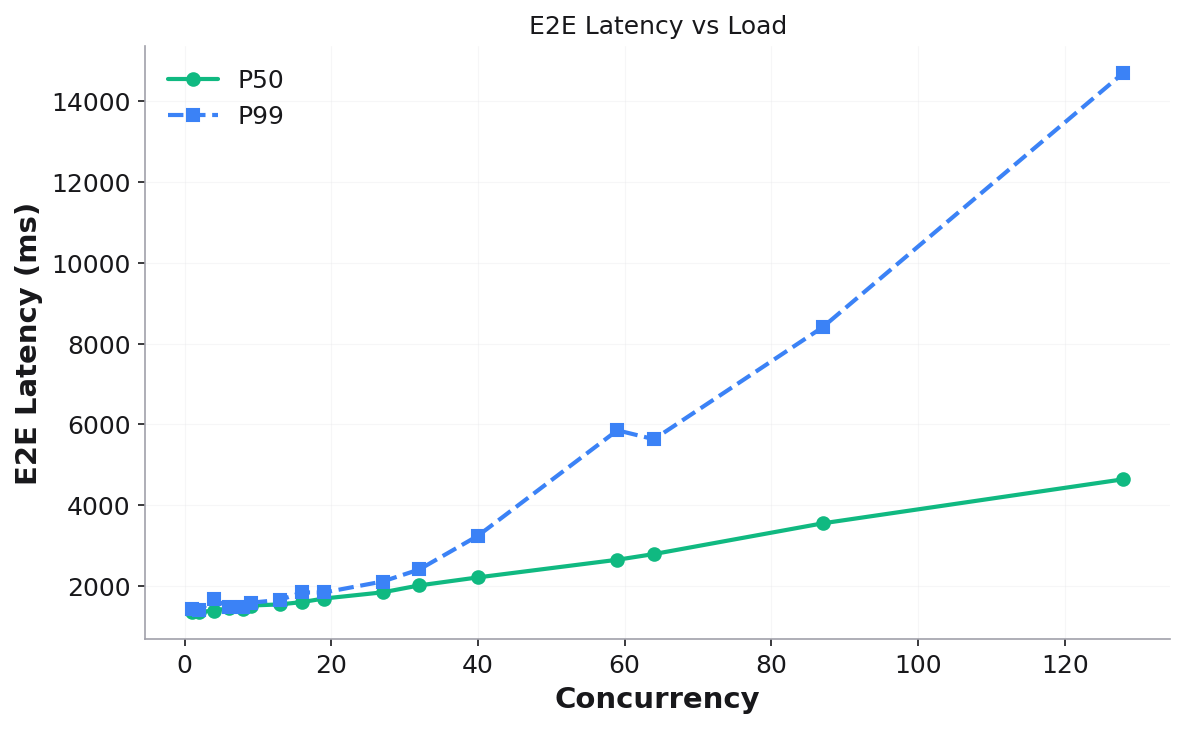
E2E Latency vs Load — P50/P99 latency growth:
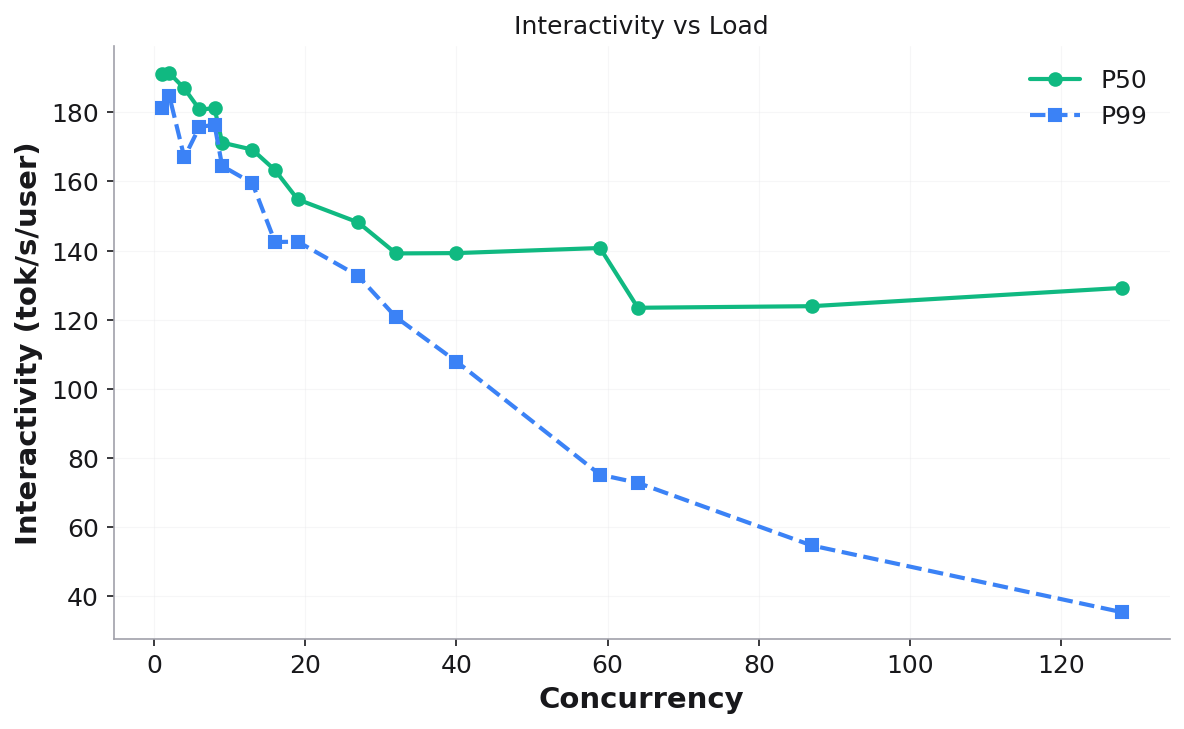
Interactivity vs Load — per-user decode speed degradation:
Additional plots: TTFC vs Load, Input Throughput vs Interactivity, Output Throughput vs Interactivity.
Validation checks: no failed requests, sufficient post-warmup samples (≥10), throughput monotonicity (warn-only).
Common options
All microbenchmarks share these options:
--api_baseOpenAI-compatible API endpoint (default:
http://localhost:8000/v1).--modelModel name for the API.
--output_dirBase output directory. Results go to
<output_dir>/<type>/<timestamp>/.--seedRandom seed for reproducibility (default: 42).
--request_timeoutPer-request timeout in seconds (default: 120).
--benchmark_timeoutTotal benchmark timeout in seconds (default: 600).
--validate_onlySkip running, only validate existing results.
--skip_validationSkip post-run validation checks.
Output directory structure
microbench_output/
├── prefill/
│   ├── 2026-03-07_21-32-19/
│   │   ├── prefill_results.json
│   │   ├── prefill_results.csv
│   │   └── plots/
│   │       └── ttfc_vs_input_length.png
│   └── latest -> 2026-03-07_21-32-19
├── decode/
│   ├── 2026-03-07_21-42-21/
│   │   ├── bs=1_il=128/
│   │   ├── bs=4_il=128/
│   │   ├── decode_results.json
│   │   ├── decode_results.csv
│   │   └── plots/
│   └── latest -> 2026-03-07_21-42-21
└── stress/
    ├── 2026-03-07_23-07-30/
    │   ├── c=1/
    │   ├── c=2/
    │   ├── ...
    │   ├── c=128/
    │   ├── stress_results.json
    │   ├── stress_results.csv
    │   └── plots/
    └── latest -> 2026-03-07_23-07-30
Each run is timestamped (UTC) and the latest symlink always points to the
most recent run.